Physical Address
304 North Cardinal St.
Dorchester Center, MA 02124
Physical Address
304 North Cardinal St.
Dorchester Center, MA 02124

Learn what a liquidity sweep means before trading the wick.
A liquidity sweep is a crypto chart move where price briefly breaks an obvious high or low to trigger clustered orders.
Traders use the phrase when Bitcoin, Ethereum, SOL, or another coin wicks through a visible level. The move may fill stop orders or breakout entries, then show whether the break was rejected or accepted. Crypto makes liquidity sweeps sharper because spot books, perpetual futures, liquidation engines, funding, and thin altcoin liquidity can all meet at the same price. That turns a neat chart idea into something messier, faster, and occasionally rude.
A liquidity sweep in crypto trading happens when price moves through a level many traders can see. That move triggers clustered orders, then either snaps back or keeps moving. The level is usually a prior high, prior low, range boundary, equal high, equal low, or round number.
Think of the level as a public meeting point. Stops, breakout buys, breakdown sells, and liquidation thresholds do not need to be visible to create pressure. They only need enough traders acting in the same area. When price hits that area, market orders can arrive in a burst. The move often looks cleaner later than it felt live.
Those areas attract liquidity because traders often place orders in similar places. Long traders may hide stop losses below a clean low. Short sellers may place buy stops above a clean high. Breakout traders may enter only after the level breaks.
So when traders say price “swept the highs,” they usually mean price took buy-side liquidity. When they say price “swept the lows,” they usually mean price took sell-side liquidity. A simple example helps:
That label is still an interpretation. It describes a chart event and a likely order cluster. It does not prove a named institution manipulated the candle, and it does not guarantee the next move.
After the break, ask one thing: did price reject the swept level, or did it accept the break and continue?
A liquidity sweep forms when an obvious level attracts orders before price reaches it. The sweep itself is the moment price pierces that level and forces those orders to execute.
The sequence usually starts before the wick. A clean high, equal highs, a prior day low, or a round number becomes visible. Traders mark it. Stops, breakout entries, and liquidation estimates begin to cluster nearby.
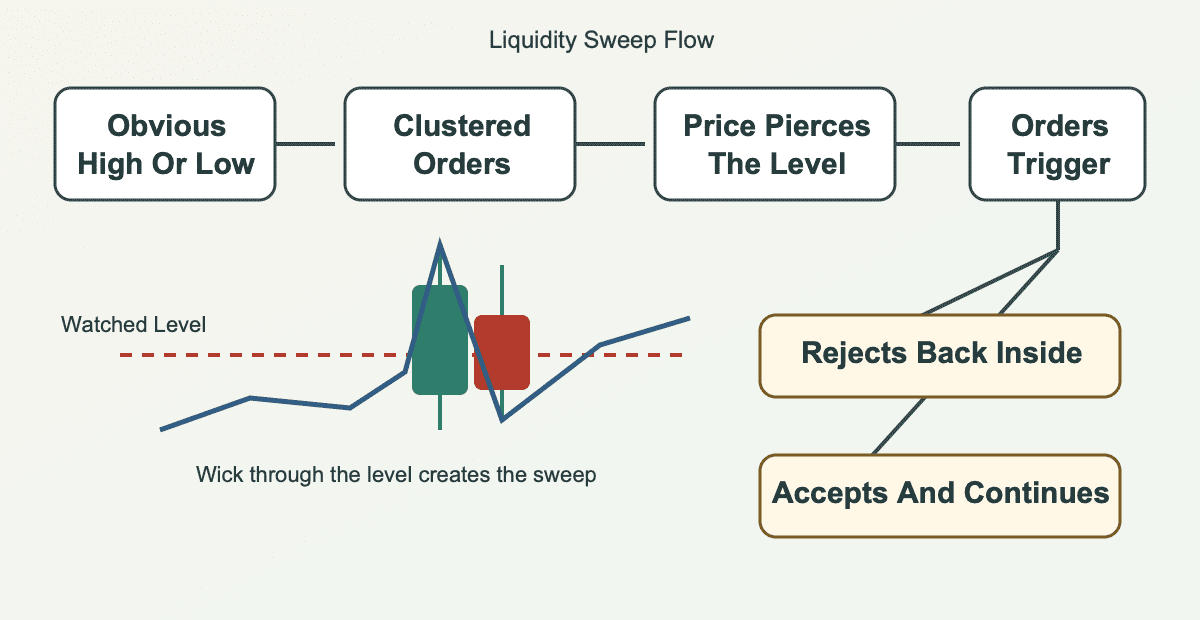
On a BTC chart, imagine price has bounced from the same support three times. Some longs place stops just below it. Some shorts wait for a breakdown entry. If price drops through that support, sell orders can fire quickly.
What happens next decides the read:
| Stage | What Traders Watch |
|---|---|
| Visible level | A prior high, prior low, range edge, or round number is clear before price arrives. |
| Orders cluster | Stops, breakout entries, and liquidation levels may sit near the same price. |
| Price pierces level | The chart breaks the high or low, often with a fast wick or short burst. |
| Orders trigger | Stop orders, market entries, and forced exits can add short-term pressure. |
| Reaction appears | Price either rejects back inside the range or accepts the break and continues. |
The candle alone is not enough. A wick through support that closes back above the level says one thing. A candle that breaks support, closes below it, and turns the old floor into resistance says something else.
That is why experienced traders mark levels before price reaches them. If the label only appears after a painful candle, it may be analysis. It may also be a coping mechanism with TradingView colors.
Buy-side and sell-side liquidity sweeps describe where the clustered orders sit, not the trade you should automatically take. This naming trips up new traders because the direction often sounds backwards.
Buy-side liquidity sits above obvious highs. Sell-side liquidity sits below obvious lows. A buy-side sweep may lead to a bearish read if price rejects. A sell-side sweep may lead to a bullish read if price reclaims. Either read can fail if the market accepts the new level.
A buy-side liquidity sweep happens when price trades above a visible high and triggers buy orders. Those buys can include short stop losses and breakout entries from traders chasing strength.
If price rejects back below the high, traders may read the move as a failed breakout. It can resemble a top signal only when rejection, follow-through, and risk context support that read. If price holds above the high, the same move may become a real breakout.
That is the part screenshots love to skip.
A sell-side liquidity sweep happens when price trades below a visible low and triggers sell orders. Those sells can include long stop losses, breakdown entries, and forced exits from margin longs.
If price reclaims the low and pushes back into the range, traders may read it as seller exhaustion. If price keeps closing below the level, the sweep idea failed, and the market may be accepting lower prices.
That is the useful danger of the phrase. It names where orders may sit. It does not replace confirmation.
Liquidity sweep, liquidity grab, stop hunt, and false breakout overlap in casual trading speech. The useful difference is what each phrase emphasizes after the level is taken.
A sweep focuses on price moving through a visible high or low. A grab stresses that resting orders were taken. A stop hunt focuses on stop losses. A false breakout focuses on failure to hold beyond the level.
| Term | Plain Meaning |
|---|---|
| Liquidity sweep | Price moves through an obvious high or low where orders may be clustered. |
| Liquidity grab | Price takes nearby liquidity, often with extra emphasis on trapped traders. |
| Stop hunt | Price moves into an area where stop losses likely sit. |
| False breakout | Price breaks a level, attracts entries, then fails to hold beyond it. |
| True breakout | Price breaks a level, holds beyond it, and keeps accepting the new area. |
| Liquidity run | Price keeps moving through liquidity instead of rejecting after the first sweep. |
| Liquidation cascade | Forced closures add pressure as leveraged positions are liquidated. |
The table is not a legal dictionary. Traders use these terms loosely, especially in fast crypto chats. A cleaner habit is to separate the event from the claim.
If price takes a high and closes back below it, “liquidity sweep” and “false breakout” may both fit. If price takes the high and keeps closing above it, calling it a trap too early can turn a real breakout into an expensive argument with the chart.
Traders try to spot a liquidity sweep by marking likely order clusters before price arrives, then waiting for the reaction after the level breaks. The goal is preparation, not prediction theater.
Start with levels everyone can see. Equal highs, equal lows, prior day highs and lows, range extremes, weekly levels, and round numbers often attract similar orders. If the level is too obscure, it may not hold enough clustered liquidity to matter. Use this checklist before treating a wick as a signal:
Stop placement matters. If your stop is exactly where everyone else is likely to place one, you may become exit liquidity for someone entering or exiting with better timing.
Fair value gaps, order blocks, market structure shifts, and change-of-character labels can support a setup. But they should not bury the basic question: did price reject the swept level, or did it accept the break? A failed liquidity sweep setup is still useful if you journal it honestly. Note the level, timeframe, reaction candle, invalidation, volume context, and result.
Liquidity sweeps hit crypto traders hard because crypto combines visible levels with margin, fragmented venues, thin liquidity, and 24/7 crowd behavior. A small chart break can become a larger forced move when too many orders sit nearby. Perpetual futures are a major reason.
Traders using margin can be liquidated when collateral runs out. So a move through support or resistance can trigger stop losses and forced exits together. Funding rates and open interest can add context when one side of the trade gets crowded. Order-book depth also needs care. CME Group reported that on April 7, 2025, E-mini S&P 500 futures volume was over 99% higher than the Q1 2025 average daily volume. It is a useful reminder that volume alone and displayed depth can tell different stories. Crypto has several extra pressure points:
This is why short-term crypto trading can feel like PVP crypto. Another trader’s stop, liquidation, or forced chase may become your fill.
Still, do not turn every sweep into a conspiracy. Large orders may seek liquidity where orders exist. Bots may react to visible structure. Thin books may move because there is not enough depth. The chart shows the result, not a signed confession.
Common liquidity sweep trading mistakes happen when traders turn a useful chart observation into a complete strategy. The wick gets the attention, but the risk plan decides whether the trade survives.
The first mistake is entering on the first break through the level. That can work sometimes, but it also leaves you exposed to continuation, a second sweep, or a candle close that never confirms the idea. Watch for these bad habits:
Oversizing is the quiet account killer. A full port bet on one sweep turns a chart read into a survival test. Smaller size gives the idea room to be wrong without turning one wick into a personal crisis.
Another mistake is stacking jargon until the trade sounds smarter than it is. A sweep plus a fair value gap plus an order block plus a market structure shift can still fail. If you cannot explain the setup in plain language, you probably cannot manage it under pressure. The best fix is boring: define the level, wait for confirmation, set invalidation, size the position, and record the outcome.
What you do after a liquidity sweep depends on whether price rejects the level, accepts the break, or gives no clean signal at all. The correct response is not always “trade it.”
Active traders usually wait for evidence. That may mean a close back inside the range, a reclaim of the swept level, a retest that holds, or a clear structure shift. The exact trigger depends on the method. The job is the same: avoid entering just because the wick looked dramatic. Use a simple split after the sweep:
For spot investors, a liquidity sweep is volatility context. It can explain why a level broke and reclaimed, but it does not replace thesis, time horizon, custody, or position sizing.
A sell-side sweep can support a bullish read only if price reclaims structure and demand follows. It is not automatically a bottom signal. A buy-side sweep can support a bearish read only if price rejects and sellers keep control. If there is no confirmation, doing nothing is a valid choice.
The market will print another candle. It always does. The account may not, if every wick becomes an urgent trade.
Related liquidity sweep concepts help when they clarify the chart event, not when they become a link pile. Counterparties, adversarial short-term trading, reversal signals, and sizing risk all sit nearby, but they do different jobs. Mix them together and a clean chart note becomes fog.
Use the related concept that answers the question the sweep created:
Exit liquidity explains who may be on the other side when orders trigger. PVP trading explains why short-term crypto levels can feel adversarial. Full-port risk belongs in the same neighborhood because position size changes the meaning of every setup. A trader using small size can log a failed sweep as feedback. A trader using the whole account may experience the same failure as a forced life lesson.
That separation keeps the term useful. A liquidity sweep is not a prophecy. It is a chart event that becomes useful only when you connect it to context, confirmation, and risk.
A liquidity sweep is when price briefly moves past an obvious high or low where many orders may sit. Those orders can include stops, breakout entries, and liquidation-related exits. The sweep becomes more useful if price then rejects back through the level or clearly accepts the break.
A liquidity sweep and a stop hunt often describe the same chart area, but the emphasis is different. A liquidity sweep focuses on price taking a high or low. A stop hunt focuses on stop losses being triggered. Neither phrase proves intent by itself.
A liquidity sweep usually describes price moving through an obvious level. A liquidity grab stresses that orders at that level were taken. Traders often use both phrases loosely, so the clearer check is what happened after the level broke.
No. A liquidity sweep can reverse, continue, or turn into chop. Reversal needs rejection and follow-through. If price accepts beyond the level and keeps closing there, the sweep idea may have failed, and the move may be a real breakout.
Yes. A liquidity sweep can happen in Bitcoin, Ethereum, SOL, XRP, and smaller altcoins. The read changes by market depth. A BTC sweep near a major level is not the same as a thin altcoin wick on one venue.
Watch the reaction after the level breaks. A liquidity sweep read becomes stronger if price rejects and reclaims the old range. A breakout read becomes stronger if price holds beyond the level, retests it cleanly, and keeps accepting the new area.