Physical Address
304 North Cardinal St.
Dorchester Center, MA 02124
Physical Address
304 North Cardinal St.
Dorchester Center, MA 02124


A practical guide to exchange inflow, sell pressure, and noisy on-chain signals.
Exchange inflow is crypto moving from an external wallet into wallets labeled as exchange wallets.
Traders watch exchange inflow because coins on an exchange are easier to sell, trade, rebalance, or post as collateral. That does not make every inflow bearish. It means every inflow deserves context.
Compare the deposit signal with outflow, netflow, reserves, asset type, exchange concentration, price reaction, and volume. One chart can warn you. It should not drive the trade by itself.
Exchange inflow means a blockchain transfer moved crypto into an address that an analytics provider labels as belonging to a centralized exchange. The sender may be a self-custody wallet, fund, market maker, miner, custodian, OTC desk, or another service.
That label is the heart of the metric. On-chain data can show a transfer. The analytics layer decides whether the receiving address belongs to an exchange. Then it groups that transfer into an exchange inflow chart.
The CryptoQuant User Guide frames exchange inflow, exchange outflow, and netflow as exchange deposits, exchange withdrawals, and their difference. That definition keeps the metric grounded in wallet movement, not rumor.
An exchange inflow usually puts coins closer to a liquid trading venue. From there, many users sell spot, post derivatives collateral, swap assets, or move funds between strategies.
But the metric stops before intent. It does not know whether the sender sold, planned to sell, posted collateral, moved coins for custody, or cleaned up wallet operations. The dashboard sees the deposit. The motive needs more evidence.
Provider wording can also vary. Some dashboards use inflow for wallet transfers into exchange-labeled addresses. Others use similar language for active buy and sell volume. Before comparing charts, confirm what each provider counts.
So the clean definition is simple: exchange inflow is a deposit-side on-chain signal. The trading interpretation comes later, after context has done its job.
Exchange inflow is one metric inside a wider exchange-flow group. If you mix the terms, the chart can look more dramatic than it really is.
Use this plain-English map before reading any exchange inflow dashboard:
| Term | What It Tells You |
|---|---|
| Exchange Inflow | Crypto moved into exchange-labeled wallets, which can increase sellable or tradable supply. |
| Exchange Outflow | Crypto moved out of exchange-labeled wallets, often toward self-custody, custody, OTC, or another service. |
| Exchange Netflow | Inflow minus outflow where the provider uses that formula. Positive netflow means more moved in than out. |
| Exchange Reserves | The total balance sitting in exchange-labeled wallets across the provider’s covered addresses. |
| Inflow Mean | Average size of inflow transactions, often watched for unusually large deposits. |
| Top Inflows | The largest exchange deposits in a period, useful for spotting whale-sized movement. |
| Transaction Count | The number of inflow transactions, which can rise even when total value is modest. |
The table shows why a single word is not enough. Total exchange inflow asks, “How much moved in?” Transaction count asks, “How many transfers moved in?” Inflow mean asks, “How large were the average deposits?”
Those questions point to different risks. Ten thousand small deposits may look like retail activity. A few huge deposits may point to whales, funds, miners, or custodians. The total value alone cannot separate those cases.
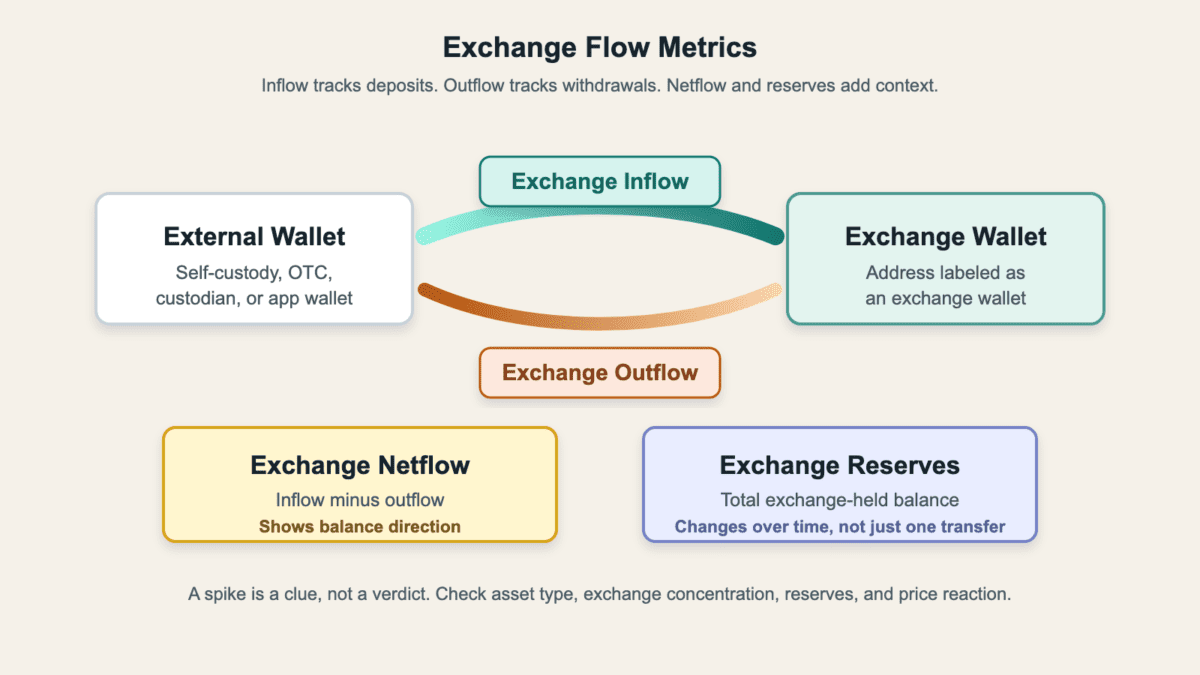
Exchange reserves add another layer. A reserve chart can rise because inflow beats outflow, or fall because withdrawals outpace deposits. It can also change when providers update labels or add newly identified exchange wallets.
Read the metric name first, then the timeframe, then the provider method. That small pause saves a lot of panic.
Traders watch exchange inflow for sell pressure because coins on exchanges are easier to sell. When BTC, ETH, or a thin altcoin moves from a private wallet to a major exchange, that supply can reach the order book faster.
That is why large inflows often get attention during rallies, panic drops, vesting-release periods, miner activity, and whale-watch threads. The market sees coins moving closer to venues where selling, hedging, and collateral movement can happen quickly.
Common sell-pressure readings include:
Those examples are all plausible. None is automatic.
Sell pressure needs confirmation from price, spot volume, order book depth, netflow, and follow-through. If large holders deposit coins during euphoria, late buyers can become exit liquidity for sellers. If the same inflow appears during a low-volume wallet migration, the signal is weaker.
Asset depth changes the risk. A large Bitcoin inflow into Coinbase may attract attention because BTC is widely tracked and liquid. A similar percentage move in a low-liquidity altcoin can hit price harder because fewer bids can absorb the supply.
Think of exchange inflow as “supply moved closer to action.” It can warn you that sellable inventory increased. It cannot tell you that a sell order already landed.
Exchange inflow does not always mean selling because deposits can happen for many reasons that never become spot sell orders. Crypto wallets move for custody, operations, collateral, rebalancing, OTC settlement, and internal exchange management.
The most common mistake is reading every large deposit as a whale dump. That can happen. But so can a custodian moving funds, an exchange rotating wallet infrastructure, a market maker balancing inventory, or a trader posting collateral for a hedge.
> A single exchange inflow spike can be wallet logistics, not a sell order. Check the exchange, asset, timeframe, and provider definition before reacting.
Hot and cold wallet movement is one source of noise. Exchanges often manage many wallets. Funds can shift between operational wallets, long-term storage, and service partners. Some movement may appear as flow depending on how a provider labels the addresses.
OTC movement can also confuse the signal. A large transfer may settle a private trade, move custody after a deal, or prepare liquidity without hitting the public order book directly.
Collateral is another reason. Traders can deposit BTC, ETH, or stablecoins to borrow, hedge, margin a perp position, or rotate exposure. That is still meaningful market activity, but it is not the same as a direct spot sale.
Address-label changes create another trap. If a provider identifies a new exchange wallet, historical charts can change. If it misses a wallet, a transfer may be excluded. Exchange inflow data is useful, but it is not a perfect ledger of intent.
Read the signal as a hypothesis. Ask what else confirms the story. If price falls on rising spot volume and netflow stays positive across several exchanges, the bearish case gets stronger. If price absorbs the deposit and reserves barely change, the signal may be noise with a dramatic haircut.
Stablecoin exchange inflow can mean buying power because USDT, USDC, and other stablecoins often enter exchanges before users buy crypto assets, post collateral, or wait for a setup. That is different from BTC or ETH moving in.
When bitcoin flows to an exchange, traders often ask whether someone is preparing to sell bitcoin. When stablecoins flow to an exchange, the question changes. The sender may be preparing to buy BTC, ETH, Solana, or smaller assets, or may be moving cash-like collateral for derivatives.
Stablecoin inflow can point to several motives:
That last point is where users get trapped. Stablecoin exchange inflow can be bullish if it becomes buying demand. It can also be defensive if traders are parking cash after selling assets.
Portfolio movement often sits between those extremes. A trader may sell an altcoin into USDT, send the stablecoins to another exchange, then rotate into a different asset. That is a form of rotation in crypto, not a simple “stablecoins in, price up” switch.
Stablecoin inflow is strongest when it matches other signs of demand. Look for rising spot volume, improving bid depth, stablecoin reserves rising while asset sell pressure fades, and price holding higher lows.
The phrase “buying power” is useful, but keep the word “potential” attached. Stablecoins can buy. They can also wait, hedge, or hide from volatility.
Exchange inflow, ETF inflow, and fiat deposits are different because they describe different routes for money or assets. Mixing them can make headlines sound like one big demand signal when the plumbing is not the same.
Use this split when reading market commentary:
| Flow Type | What It Usually Means |
|---|---|
| On-Chain Exchange Inflow | Crypto moved into exchange-labeled wallets. It may become sellable, tradable, or collateralized. |
| ETF Inflow | Money entered an ETF product, usually through fund shares and authorized creation flows. |
| Fiat Exchange Deposit | A user added dollars, euros, or another fiat currency to an exchange account. |
| Stablecoin Exchange Inflow | Stablecoins moved onto an exchange and may become buying power, collateral, or parked cash. |
| Broad Retail Inflow | New or returning public interest brings fresh accounts, deposits, and attention into crypto. |
A BTC transfer to Coinbase is an exchange inflow. Money entering a spot Bitcoin ETF is ETF inflow. A bank transfer into an exchange account is a fiat deposit. Those events can influence the same market, but they are not the same data point.
Broad new retail participation is closer to normie inflow than exchange inflow. It describes who is arriving and how much public attention is forming, not only whether coins moved into exchange wallets.
The distinction helps during headline-heavy weeks. “Inflows are rising” may refer to ETF demand, stablecoins, BTC deposits to exchanges, or fiat on-ramps. Check the noun after “inflow” before acting on the verb.
An exchange inflow spike is a signal to investigate, not a command to sell. The goal is to find whether the spike points to real sell pressure, operational movement, stablecoin liquidity, or a dashboard quirk.
Start with the chart settings. A one-hour spike can look huge on a short window and ordinary on a multi-week view.
Then check the asset. Bitcoin, ETH, stablecoins, and thin altcoins do not carry the same market meaning.
Run these checks before reacting:
Total inflow, mean inflow, and transaction count answer different questions. Total inflow shows the amount. Mean inflow hints at average deposit size. Transaction count tells you whether many wallets moved or only a few.
CryptoQuant Research reported an hourly Bitcoin exchange inflow spike of about 11,000 BTC in April 2026. That is the kind of scale where the next question should be “what else confirmed it?” rather than “how fast can I panic-click?”
Here is a simple example:
> Imagine BTC exchange inflow jumps from 5,000 BTC to 18,000 BTC in one day. If outflow is also high and reserves barely rise, the market may be churning. If netflow turns strongly positive, reserves rise, old coins move, and price fails on high volume, the sell-pressure reading becomes more serious.
Even then, do not turn one metric into a fortune cookie. Exchange inflow paired with euphoria, weak bids, and heavy volume can become one possible top signal. Exchange inflow alone is just a clue with a busy calendar.
Your job is not to predict every whale. It is to avoid overreacting to a chart that has not earned the trade.
Exchange inflow has limits because it depends on address labels, provider coverage, exchange wallet structure, and dashboard definitions. The transfer is on-chain. The interpretation sits on top of it.
Providers maintain exchange address clusters by identifying wallets that likely belong to centralized exchanges. Those labels can improve, lag, or change. New wallets appear. Old wallets go quiet. Exchanges rotate infrastructure. Custodians may move funds in ways that look exchange-adjacent.
> Compare provider methodology before comparing screenshots. Two dashboards can use similar names while counting different wallets, assets, chains, or trade-flow concepts.
Internal transfers are a major trap. Some wallet movement belongs to exchange operations rather than user deposits. If a provider does not separate those flows cleanly, the chart may overstate the market signal.
Chain coverage can change the reading. A dashboard may cover Bitcoin well but handle certain tokens, bridges, or wrapped assets differently. Multi-chain assets can make the same user action appear in more than one place when the data scope is unclear.
Definition drift is another issue. Some tools use exchange inflow for wallet-to-exchange deposits. Others use inflow and outflow language around spot trading pressure or active buy and sell volume. Both can be useful, but they are not interchangeable.
False precision is the final trap. A chart can show a neat number with decimals, a timestamp, and a serious interface. That does not make the inferred motive precise. A clean chart can still hide messy labels.
Use exchange inflow as a probability signal. It gets better when several providers, timeframes, and market reactions point in the same direction. It gets worse when one screenshot carries the whole argument.
Exchange inflow changes meaning by asset because each market has different holders, liquidity, custody habits, and reasons to move funds. The same spike can look different in Bitcoin, ETH, and a small altcoin.
Bitcoin exchange inflow often gets tied to long-term holders, miners, exchange reserves, and old-coin movement. If old coins that have sat untouched for years move to exchanges, traders pay attention because long-dormant supply may be waking up.
ETH exchange inflow needs a wider frame. ETH can move for selling, staking-related liquidity, DeFi collateral, wrapped positions, NFT-related activity, treasury management, or gas planning. An ETH deposit may be market pressure, but it may also support another on-chain or venue-based strategy.
Altcoin exchange inflow can be sharper because liquidity is often thinner. A deposit that looks modest in dollar terms can still move price if the order book is shallow, a vesting release is nearby, or the exchange listing just made selling easier.
This quick split helps keep the signal grounded:
| Asset Context | Better Exchange Inflow Question |
|---|---|
| Bitcoin | Are long-term holders, miners, or large wallets moving supply toward liquid venues? |
| ETH | Is the transfer tied to spot selling, collateral, staking liquidity, or DeFi movement? |
| Large Altcoins | Is the move broad market rotation or a token-specific event? |
| Thin Altcoins | Can the receiving exchange absorb the deposit without heavy slippage? |
| Stablecoins | Is cash-like liquidity arriving, parking, rotating, or supporting collateral? |
The same exchange inflow number can carry different risk across these markets. Bitcoin may need multi-day confirmation. A thin altcoin may only need one large deposit and weak bids to wobble.
So do not read every asset through the Bitcoin lens. Liquidity depth, holder base, and the reasons funds move are part of the signal.
Start with exchange inflow data by slowing the chart down. A multi-day trend is usually more useful than a single alert, especially when the alert comes from a screenshot without methodology.
Then compare the deposit signal with nearby metrics. Exchange inflow is stronger when netflow, reserves, price reaction, volume, and asset type agree. It is weaker when those signals conflict.
Decide what would change your view before zooming into the smallest timeframe. If price, volume, and netflow must confirm the deposit, the chart becomes an input instead of a dare.
Use this short routine before reacting:
If the chart still looks serious, reduce the question to one sentence: “Did more sellable supply move to exchanges, and did the market react as if sellers used it?”
When the answers conflict, wait for cleaner confirmation or lower the confidence of the signal. A boring routine is the point. It keeps one bright dashboard line from turning into a panic trade.
That sentence will not predict everything. It will keep the exchange inflow signal in its proper place: useful, noisy, and never important enough to replace price, liquidity, and common sense.
Exchange inflow can be bearish when BTC, ETH, or another asset moves onto exchanges and the market confirms sell pressure. Confirmation can include positive netflow, rising reserves, falling price, heavy spot volume, or large old-coin deposits.
It is not automatically bearish. Coins can move to exchanges for custody, collateral, rebalancing, market making, OTC settlement, or internal wallet management. Read the inflow with outflow, netflow, reserves, asset type, and price reaction.
Exchange inflow does not prove whales are selling. A large deposit may come from a whale, fund, miner, custodian, OTC desk, or exchange operation. Wallet size can suggest who moved coins, but it does not prove intent.
The whale-selling case gets stronger when a few large deposits hit major exchanges, netflow rises, reserves increase, price weakens, and spot volume confirms distribution. Without that context, “whale dump” is often just chart theater with better lighting.
Exchange netflow is commonly calculated as exchange inflow minus exchange outflow. Positive netflow means more crypto moved into exchange-labeled wallets than moved out during the measured period. Negative netflow means withdrawals were larger than deposits.
Netflow helps because inflow alone can hide the other side. If 10,000 BTC moves in and 9,800 BTC moves out, the net balance change is small. If inflow rises while outflow dries up, the market may face more sellable supply.
Stablecoin exchange inflow can be bullish when it represents buying power arriving on exchanges. USDT or USDC deposits may sit ready for spot purchases, rotations into risk assets, or collateral for new positions.
But stablecoin inflow is not always bullish. Traders may park cash after selling, move collateral defensively, or wait for lower prices. The signal improves when stablecoin inflow appears with stronger bids, rising spot volume, and asset prices holding firm.
ETF inflows are not the same as exchange inflows. ETF inflows describe money entering an ETF product. Exchange inflow describes crypto moving into exchange-labeled wallets on-chain.
Both can affect the same market, especially around Bitcoin headlines, but they measure different routes. A BTC deposit to an exchange can suggest sellable supply. Money entering a spot Bitcoin ETF can suggest fund demand. Do not blend them into one signal.
Exchange inflow data can be incomplete or misleading because it depends on address labels, exchange wallet structures, provider coverage, and definitions. A provider can miss a new wallet, update an old label, or classify internal movement differently.
That does not make the metric useless. It means single spikes need caution. Compare methodology, check more than one timeframe, and look for market confirmation before treating exchange inflow as a serious trading signal.