Physical Address
304 North Cardinal St.
Dorchester Center, MA 02124
Physical Address
304 North Cardinal St.
Dorchester Center, MA 02124


Avoid the exchange netflow trap before one chart pushes a trade.
Exchange netflow is the net movement of crypto into and out of exchange-labeled wallets during a chosen time period.
Traders watch it because exchange wallets sit close to market action. Coins moving in can hint at sellable supply. Coins moving out can hint at self-custody, accumulation, custody changes, or plain old wallet plumbing.
The useful habit is to read exchange netflow as a signal, not a verdict. It works best when you compare the asset, timeframe, provider method, exchange coverage, price reaction, spot volume, reserves, and stablecoin flow.
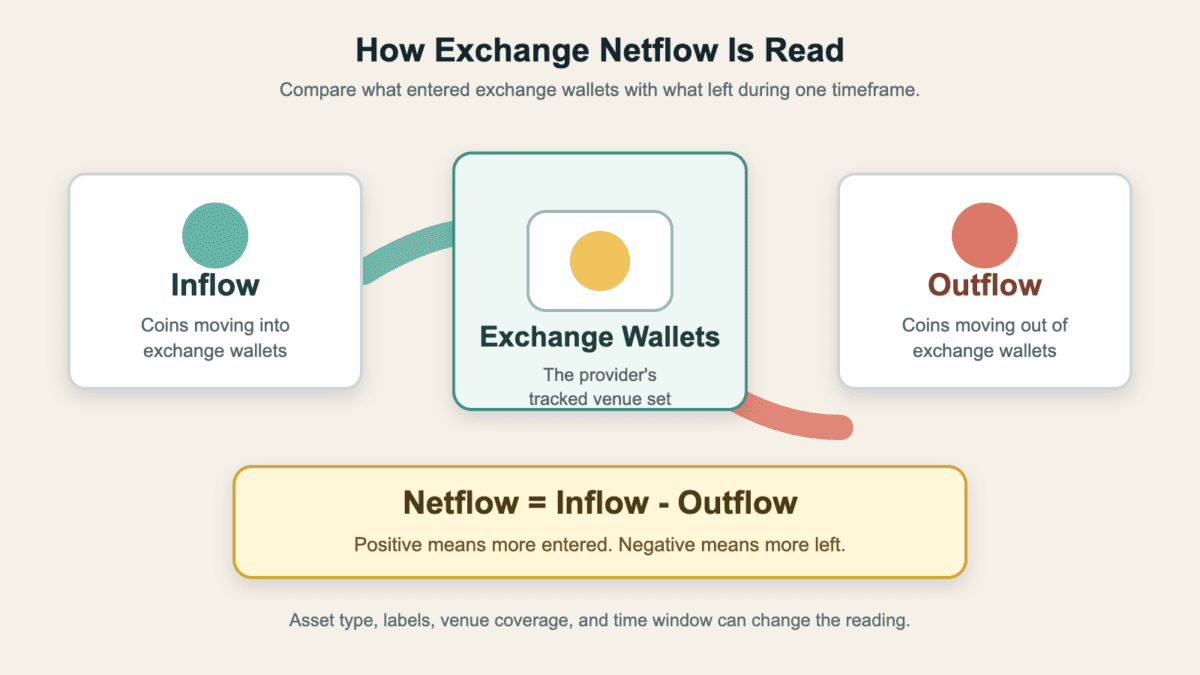
Exchange netflow in crypto measures whether tracked exchange wallets received more crypto than they sent out over a set period. The standard formula is simple: exchange inflow minus exchange outflow.
If 10,000 coins move into exchange-labeled wallets and 7,000 coins move out during the same window, exchange netflow is positive 3,000 coins. If 7,000 move in and 10,000 move out, netflow is negative 3,000 coins.
That sign comes before the market story. Positive exchange netflow means more of the tracked asset ended the period inside exchange-labeled wallets. Negative exchange netflow means more left those wallets than entered.
Use these first checks before reading the signal:
For BTC or ETH, positive exchange netflow often gets read as possible sell-side supply. Negative exchange netflow often gets read as reduced immediate exchange supply. Those are reasonable starting points, but not final answers.
The metric does not know intent. A large deposit can be a planned sale, derivatives collateral, exchange-to-exchange movement, market-maker inventory, or a custodian moving funds. A large withdrawal can be self-custody, OTC settlement, cold storage, or internal housekeeping.
So the clean exchange netflow meaning is this: it shows the balance of exchange deposits and withdrawals. The trading read comes later, after price, volume, reserves, and venue context support it.
Exchange netflow is usually calculated by tracking crypto transfers into and out of wallets labeled as exchange wallets. Inflow is the deposit side. Outflow is the withdrawal side. Netflow compares both across the chosen timeframe.
The CryptoQuant User Guide uses the standard formula: exchange netflow equals exchange inflow minus exchange outflow. That is the version most traders expect when they open an exchange-flow chart.
Provider methods can still differ. Some dashboards group transfers by exchange address labels. Others frame net flows as the change in exchange-held balances from one snapshot to another. A balance-snapshot method can produce a different number than a pure transfer formula.
Dashboard numbers can disagree for several normal reasons:
Sign convention also needs checking. In the standard formula, positive exchange netflow means inflow beat outflow. Negative exchange netflow means outflow beat inflow.
That sounds basic, but it prevents expensive confusion. If you read a CoinGlass spot netflow table, a CryptoQuant chart, and a Glassnode-style exchange chart on the same day, confirm the formula before comparing red and green bars.
Exchange netflow sits beside several similar metrics. The confusion usually starts when market commentary blends flow, balance, volume, and fund flows into one dramatic sentence.
Use this map before reacting to a dashboard:
| Term | Plain Meaning |
|---|---|
| Exchange Inflow | Crypto moved into exchange-labeled wallets. |
| Exchange Outflow | Crypto moved out of exchange-labeled wallets. |
| Exchange Netflow | Inflow minus outflow, where the provider uses that formula. |
| Exchange Reserves | The total balance sitting in exchange-labeled wallets. |
| Spot Netflow | Net movement tied to spot exchange venues or spot-flow tables. |
| Stablecoin Exchange Netflow | Net stablecoin movement into or out of exchange wallets. |
| ETF Flow | Money moving into or out of an ETF product, not a wallet transfer. |
| Fiat Deposit | Cash added to an exchange account, usually off-chain. |
| Spot Volume | Actual spot trading activity during a period. |
The table prevents a common mistake because each metric answers a different question. Exchange netflow asks whether tracked wallets gained or lost crypto during a period. Exchange reserves ask how much is sitting there after many periods.
Spot volume is another category. It can confirm that coins actually traded, while exchange netflow only shows movement near trading venues.
ETF flows are different again. They track fund demand, share creation, and redemption mechanics. That can affect market liquidity, but it is not the same as coins moving from a wallet to an exchange wallet.
Positive exchange netflow means more of the tracked asset moved into exchange-labeled wallets than moved out during the measured period. For BTC or another volatile asset, that can point to more supply sitting near sell buttons.
That is why traders often read positive exchange netflow as a possible warning. If it appears after a fast rally, it can look like a top signal when price stalls, volume rises, and deposits keep coming.
But positive exchange netflow is not a guaranteed dump signal. Deposits can support market making, arbitrage, collateral management, OTC settlement, or exchange-to-exchange routing. Some deposits never become spot sales.
Read positive exchange netflow with nearby evidence:
The stronger bearish case is a cluster, not one bar. Imagine BTC exchange netflow turns positive for several days while price fails to reclaim a range, spot volume rises on down candles, and exchange reserves rise. That combination deserves more caution than a single daily spike.
Sell-side pressure can also turn late buyers into exit liquidity when large holders are ready to unload. That risk is not automatic. It grows when the market keeps absorbing deposits poorly.
Negative exchange netflow means more crypto left tracked exchange wallets than entered during the measured period. For BTC, ETH, or another volatile asset, traders often read that as coins moving away from immediate selling venues.
That can support a self-custody or long-term holding story. Users may withdraw to hardware wallets, custodians, cold storage, or other wallet options when they do not need the coins on an exchange.
Bitcoin communities often turn persistent negative exchange netflow into a supply-shock narrative. The basic idea is simple: fewer coins on exchanges can mean less immediate sellable supply. The market version usually adds a cape and starts acting too certain.
The bullish reading gets stronger when these checks align:
Negative exchange netflow can also appear near a bottom signal narrative when coins leave exchanges after heavy selling. It still needs confirmation from demand, sentiment, volume, and broader market structure.
A useful warning: withdrawals can be custody reshuffles, OTC settlement, exchange wallet cleanup, or movement to another service. Less exchange supply is not a price guarantee. It is one part of the market map.
Exchange netflow, exchange reserves, ETF flows, and stablecoin flows often appear in the same market update. They are different signals.
Netflow measures movement during a period. Reserves measure the balance sitting on exchange-labeled wallets after many inflows and outflows. ETF flows track fund activity. Stablecoin flows can show potential buying power or liquidity leaving exchanges.
Here is the clean split:
| Metric | What It Tells You |
|---|---|
| Exchange Netflow | Whether tracked exchange wallets gained or lost the asset during a timeframe. |
| Exchange Reserves | How much of the asset is held in tracked exchange wallets. |
| ETF Flow | Whether money moved into or out of an ETF product. |
| Stablecoin Flow | Whether stablecoins moved toward or away from exchange liquidity. |
| Spot Volume | How much spot trading happened during the period. |
The difference changes the interpretation. BTC exchange netflow can hint at asset supply moving near trading venues. BTC reserves show the broader exchange-held balance. ETF inflows can show institutional product demand without requiring a retail wallet transfer.
Stablecoin flow flips much of the usual instinct. USDT or USDC moving onto exchanges may mean traders are bringing buying power, not preparing to sell BTC. The same word “inflow” can point in the opposite direction depending on the asset.
So separate the metric before reading the mood. If an update mixes ETF demand, exchange reserves, stablecoin liquidity, and BTC netflow in one breath, slow it down. Each one adds context, but none replaces the others.
Stablecoin exchange netflow reads differently because stablecoins are usually the quote asset, not the risk asset traders are dumping. USDT and USDC moving onto exchanges can mean cash-like liquidity is arriving.
For BTC or ETH, positive asset exchange netflow can raise concern about possible selling. For stablecoins, positive exchange netflow can mean traders are preparing to buy, park funds, move collateral, or rotate across pairs.
That does not make stablecoin inflow automatically bullish. The money may sit idle. It may support derivatives collateral. It may move because a market maker is balancing inventory across venues.
So read stablecoin exchange netflow beside what the market actually does next. If stablecoins arrive and spot bids deepen, the buying-power story becomes more credible. If stablecoins arrive while price keeps sliding and order books stay thin, the flow may be defensive cash parking instead.
Use this example carefully:
> If BTC exchange netflow is positive while stablecoin exchange netflow is falling, sell-pressure risk can look stronger. If BTC netflow is negative while stablecoin netflow is rising, the market may have more dry powder for spot demand.
Even then, stablecoin data needs venue context. A large USDT inflow to one exchange can mean one desk moved funds. Broad inflows across several venues are more useful than one flashy deposit.
Also check whether the stablecoin movement sits on spot venues or derivatives-heavy venues. Funds moving toward futures collateral can support derivatives positioning instead of spot buying. That split helps traders decide whether liquidity is arriving for accumulation or for a crowded futures trade.
The key is asset type. A BTC inflow and a USDT inflow can both be “positive exchange netflow,” but they do not tell the same story. Same sign, different job.
Traders use exchange netflow best as a confirmation tool. It can support a market read, but it should not become the trade by itself. One chart is a clue with a public relations team.
Start with timeframe. A one-hour spike can be noise. A daily move can matter more. A seven-day, 30-day, or longer trend can show whether the flow is persistent or just one wallet doing admin work.
A precise number still needs context. A one-day BTC netflow flip can show direction for that session, but it still needs the next sessions, reserves, price reaction, and volume before it becomes a market read.
Then compare the flow with market behavior. If price absorbs positive exchange netflow without breaking down, sellers may be weaker than the chart implies. If price falls on heavy spot volume while netflow stays positive, risk rises.
Run this checklist before reacting:
Altcoin netflow needs extra care. Thin order books, vesting releases, market-maker movement, and one dominant exchange can distort the signal fast.
Stablecoin and altcoin flows can also show rotation between assets rather than simple accumulation or selling. A trader may sell one token into USDT, move funds to another venue, and buy a different sector hours later.
Keep the rule conservative. Use exchange netflow to ask better questions, not to outsource judgment to a red or green bar.
Exchange netflow can give false signals because wallet movement does not equal market intent. The blockchain records transfers. Analytics providers add labels. The motive still needs context.
Large movements can look dramatic for reasons that are not simple buying or selling. Exchanges move funds between hot wallets and cold wallets. Custodians rebalance storage. OTC desks settle trades away from public order books.
Common false-signal causes include:
The same transfer can also mean different things at different venues. A deposit to a spot-heavy exchange may matter more for immediate selling. A deposit to a derivatives-heavy venue may be collateral, hedging, or market-maker inventory. The chart can show the move, but it cannot tell you the desk’s intention.
Provider labels are useful, but they are not perfect. A newly identified exchange address can change historical charts. Recent data can also update after more addresses are classified.
This is why a huge outflow is not automatically accumulation. It can be cold storage. It can also be an exchange moving funds under the hood. Same chart shape, very different story.
Use exchange netflow like a smoke alarm, not a weather forecast. It can tell you something needs checking. It cannot tell you, alone, who is about to buy or sell. The next step is always the same: check reserves, venue concentration, price reaction, and whether the transfer has a boring operational explanation.
The best exchange netflow tools depend on what you want to check. Some tools focus on on-chain address labels. Others focus on spot-flow tables, reserve charts, or entity tracking.
For most users, the right setup is not one favorite dashboard. It is a small stack that lets you compare methodology, time window, venue coverage, and nearby market signals.
Start with a dashboard that explains its formula. Then compare it with one different provider or table view before treating the signal as meaningful. If both show the same direction across a similar timeframe, the read is stronger. If they disagree, the method difference is part of the lesson.
Useful tool categories include:
Do not rank tools only by how dramatic the chart looks. A good tool should make the asset, timeframe, exchange set, and calculation method easy to understand.
Use entity-label tools when the question is about a specific wallet, whale, exchange cluster, or custodian. Use spot-flow tables when the question is about venue-level market pressure. Use charting tools when you need price, volume, and flow on the same screen.
If two providers disagree, do not assume one is broken. Check whether one uses transfer netflow, another uses balance change, and another updates labels differently. The disagreement can teach you what the metric really measures.
Start with the sign, but do not stop there. Positive exchange netflow means inflow beat outflow. Negative exchange netflow means outflow beat inflow. That is the translation, not the trade.
Next, look for persistence. One bar can be noisy. Several periods pointing the same way deserve more attention, especially when reserves, price reaction, and spot volume agree.
Use these practical next actions:
If those checks do not line up, step back. A clean exchange netflow read should survive more than one dashboard and more than one candle. When it cannot, the honest conclusion is usually that the signal is incomplete.
Then look for false-positive causes. Internal wallet movement, OTC settlement, custody changes, derivatives collateral, and label updates can all bend the signal.
Exchange netflow is useful because it slows down vague market talk. It turns “coins are moving” into better questions about where, when, which asset, and what else confirms the move.
That is the real edge for a beginner or intermediate user. You are not trying to predict the next candle from a wallet label. You are trying to avoid mistaking plumbing, collateral, or one whale transfer for the whole market.
Exchange netflow in crypto is the net movement of an asset into and out of exchange-labeled wallets during a chosen period. In the standard formula, exchange netflow equals inflow minus outflow. Positive netflow means more moved in than out. Negative netflow means more moved out than in.
No. Positive exchange netflow can raise sell-pressure concerns for BTC, ETH, or another volatile asset, but it is not always bearish. Deposits can reflect trading, collateral movement, market making, custody changes, exchange-to-exchange transfers, or OTC settlement. It becomes more useful when price, volume, reserves, and venue concentration confirm the risk.
No. Negative exchange netflow can support a bullish supply narrative, especially when withdrawals persist and exchange reserves fall. But withdrawals can also reflect custody reshuffling, OTC settlement, internal exchange movement, or funds moving to another service. It is a stronger signal when demand and price action support the outflow story.
Exchange netflow numbers differ because providers use different address labels, exchange coverage, time windows, asset coverage, and calculation methods. One tool may use inflow minus outflow. Another may use balance changes between snapshots. Recent points can also revise after wallet labels improve or exchange clusters are updated.
Exchange netflow measures movement during a period. Exchange reserves measure the total balance held in exchange-labeled wallets. Netflow tells you whether exchange balances likely rose or fell during the timeframe. Reserves show the broader balance after many prior inflows, outflows, label changes, and custody movements.
Exchange netflow can add useful context, but it cannot predict crypto prices by itself. Price depends on demand, liquidity, spot volume, derivatives positioning, market news, stablecoin flows, and broader risk appetite. Use exchange netflow as a confirmation signal, not a crystal ball with a trading account.