Physical Address
304 North Cardinal St.
Dorchester Center, MA 02124
Physical Address
304 North Cardinal St.
Dorchester Center, MA 02124


Learn what a local bottom means before chasing a bounce.
A local bottom in crypto is a temporary price low on a chosen timeframe, not proof the whole market has bottomed.
Traders use the phrase after a dump, a support test, or a liquidation wick when price stops falling for a while. That pause can create a useful trade. It can also create a very polite trapdoor if the larger trend still points down.
Ask this before acting: which timeframe, which asset, and what evidence would prove the call wrong?
A local bottom in crypto is a short-term or medium-term low that forms inside a defined chart window. It often becomes visible after price sells into support, prints a swing low, and bounces enough for traders to notice.
The word “local” does the heavy lifting. It means the low belongs to a specific area of the chart, not the entire market cycle. Bitcoin can form a local bottom on a 4-hour chart while the weekly chart still looks weak. An altcoin can bounce from a local low while the broader market keeps draining liquidity.
Think of it as a nearby floor, not the basement of the whole building.
Common local bottom language shows up around:
For example, imagine a token falls from 100 to 72, bounces to 84, retests 73, and then moves back above 80. Traders may call the 72 to 73 area a local bottom. That still does not prove the token is healthy. It only says sellers failed to push price lower in that chart window.
You will often see the phrase spread through crypto Twitter shorthand, Telegram chats, Discord groups, and charting posts. The tone can be serious, sarcastic, or hopeful. The chart does not care which one.
A local bottom is a smaller low inside a larger move. A macro bottom is a broader market low that may mark the end of a major correction or bear phase.
That difference changes the entry plan. If a trader says “bottom is in,” they may mean a 15-minute scalp, a weekly Bitcoin low, an altcoin accumulation range, or the end of a full cycle. Same phrase. Very different risk.
Use the label only after naming the timeframe and asset:
| Term | What It Means And Does Not Prove |
|---|---|
| Local Bottom | A nearby low on a chosen timeframe. It does not prove the larger downtrend has ended. |
| Swing Low | A chart point where price turns upward after falling. It does not prove buyers control the whole trend. |
| Macro Bottom | A broader low across a market or major asset. It does not become obvious in real time. |
| Cycle Bottom | The major low of a full market cycle. It is usually confirmed only after a large recovery. |
| All-Time Low | The lowest recorded price for an asset. It does not automatically mean value exists. |
| Double Bottom | A pattern where price tests a similar low twice. It does not confirm unless the bounce holds. |
The trap is applying a small signal to a big decision. A local bottom may justify watching a reclaim or planning a small entry. It should not automatically justify going all-in because the chart stopped bleeding for one afternoon.
This split also explains why people can argue online and both be partly right. A trader may be right that Bitcoin found a local bottom after a liquidation flush. A longer-term investor may still be right that the crypto market has not repaired its weekly structure.
So make the claim smaller before you act on it. “BTC may have a local bottom on the daily chart” is useful. “Crypto bottomed” is a fog machine with candlesticks.
Traders try to spot a local bottom by looking for evidence that selling pressure is slowing and buyers are absorbing supply. No single signal confirms it by itself.
The cleaner workflow starts with price structure, then checks volume, momentum, derivatives, and on-chain stress. If those clues point in the same direction, the local bottom call becomes more credible. If they conflict, the bounce may only be noise.
Use signals as questions before trusting them:
| Signal | What To Verify Before Trusting It |
|---|---|
| Support Retest | Price should hold the zone, then reclaim nearby resistance. |
| Higher Low | The next pullback should stay above the panic low. |
| Long Lower Wick | The wick should lead to follow-through, not another immediate dump. |
| Volume Spike | Volume should show real absorption, not a single thin squeeze. |
| RSI Divergence | Momentum should improve while price stops making fresh lows. |
| MACD Shift | Momentum should turn with price structure, not before it. |
| Funding Reset | Crowded perp exposure should cool without instantly rebuilding. |
| Open Interest Flush | Crowded positions should clear before a cleaner move forms. |
| Liquidation Cascade | Forced selling may be exhausted, but confidence may also be damaged. |
| SOPR Or MVRV Stress | Holder loss pressure may be easing, but on-chain clues still need chart confirmation. |
This is where a deeper bottom signal checklist helps. A local bottom is the price area. A bottom signal is the evidence that sellers may be running out of force near that area.
On-chain metrics deserve plain English. SOPR can help describe whether coins are moving at profit or loss. MVRV compares market value with realized value. Realized loss shows how much pain sellers accepted when they moved coins.
In its Week 26 2025 note, Glassnode pointed to Bitcoin holding a short-term-holder cost basis of $98.3K as a level that often separates local bullish and bearish conditions. That kind of data can add context, especially for Bitcoin. It still cannot promise the next candle.
The best signal is usually agreement. Price holds support. Volume appears on the bounce. Funding cools. Open interest stops rising into every green candle. Sentiment is fearful, but panic selling no longer accelerates.
That is not prophecy. It is a better reason to slow down and watch the next pullback.
A local bottom can look like a sharp V, a slow rounded base, a double bottom, or a range reclaim. The shape is less important than what price does after the low.
Crypto charts can move violently because they trade around the clock and often carry crowded perp positions. A liquidation cascade can create a huge lower wick, then a fast bounce. That can be a real local bottom. It can also be a chase zone if the next pullback slices straight through support.
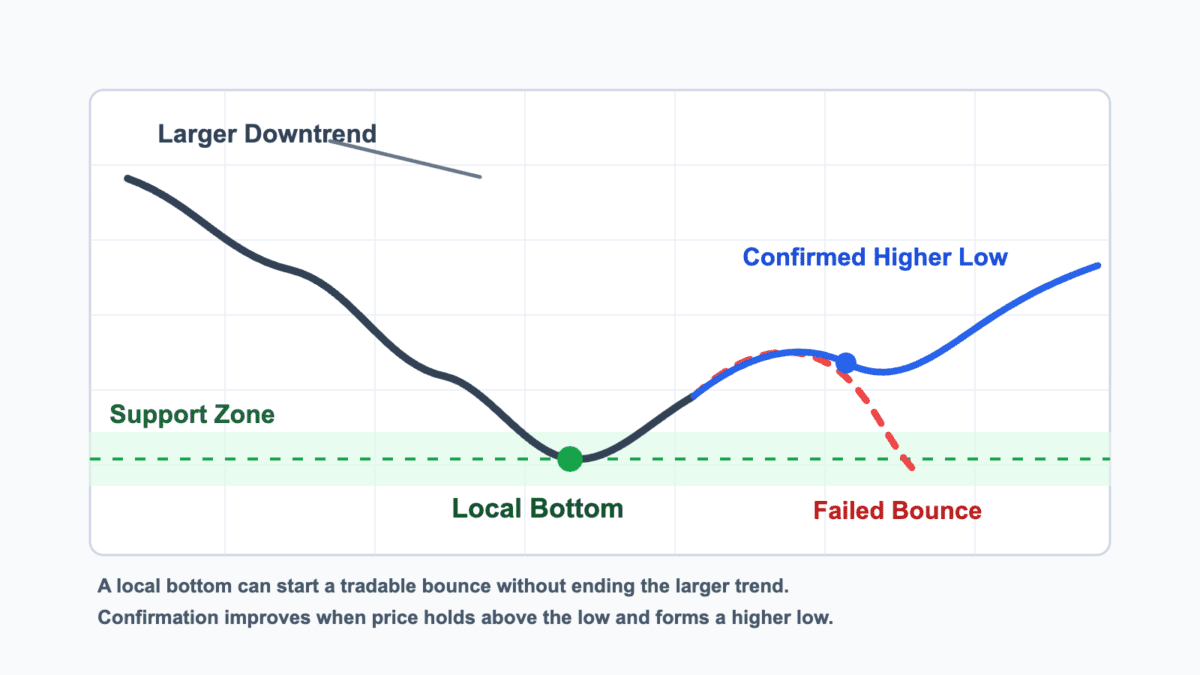
Common shapes need different confirmation:
| Chart Shape | What Confirmation Usually Looks Like |
|---|---|
| V-Bottom | Price rebounds fast, then holds above the wick on the first real pullback. |
| Rounded Bottom | Selling slows over time while price builds a base. |
| Double Bottom | Price retests a similar low, then breaks above the middle bounce. |
| Range Reclaim | Price breaks below a range, returns inside it, then holds the reclaim. |
| Higher-Low Base | Each pullback holds above the last low, showing buyers stepping up. |
A double bottom gets the most attention because the W shape is easy to see. But a local bottom does not need a perfect W. It can be one ugly wick, a failed breakdown, or a slow base where sellers simply stop getting paid.
The chart also depends on the asset. Bitcoin and Ethereum usually have deeper liquidity than small altcoins. A small token can print a beautiful bottom shape because one wallet stopped selling for an hour. Beauty, in that case, is not a risk model.
The practical check is simple. Mark the low, mark the reclaim, and mark the level that would prove the bounce failed. If you cannot name that invalidation level, you are not reading a bottom. You are admiring a candle.
Local bottom calls fail when a bounce gets mistaken for a repaired market. Crypto makes this mistake easy because relief rallies can be fast, loud, and emotionally convincing.
A dead-cat bounce can start from a real local low and still fail. Price may recover because forced sellers are gone for the moment, not because durable demand returned. Once early buyers take profit or new sellers appear, the bounce loses its legs.
Several crypto-specific failure modes deserve caution:
The nastiest version is a bounce that attracts late buyers just as earlier holders sell into them. That is where exit liquidity stops being a meme and becomes portfolio damage.
The warning is plain: a local bottom can be tradable without being investable. It can give a trader a bounce and still punish someone who treats it like a long-term floor.
Capitulation can also confuse the read. Heavy selling, liquidations, and fear may appear near a local bottom because weak hands are forced out. But capitulation is a condition, not a receipt. The market still needs to hold structure afterward.
Altcoins add another wrinkle. A Bitcoin local bottom can stabilize the broader mood while weaker coins keep falling. Some alts recover later. Some never recover. A chart that needs a miracle rebrand is not “early.” It is paperwork with a ticker.
Investors can use a local bottom as a risk checkpoint, not as a demand to catch the exact wick. The goal is to improve entries without turning the chart into a fortune cookie.
For spot buyers, a local bottom can help with staged entries. Buying in parts reduces the pressure to be perfect. It also leaves room if the first bounce fails and the market retests lower support.
For active traders, the same setup needs a tighter plan. A trader should know the entry zone, invalidation level, expected bounce area, and position size before clicking. Borrowed exposure makes that plan stricter because liquidation can arrive before the broader idea has time to work.
Match the response to the job:
Averaging down deserves special care. It can improve cost basis in a strong asset. It can also turn a failed bounce into bagholder risk when the reason for owning the asset has broken.
The key split is between process and prediction. Process says, “I will add one tranche if support holds and stop adding if it fails.” Prediction says, “This is the bottom because I want it to be.” One sounds boring. The other often gets expensive.
Doing nothing can be valid too. If the timeframe is unclear, volume is weak, macro pressure is heavy, or the asset is illiquid, waiting is a position. It just has no dopamine button.
A local bottom checklist helps you slow down before acting on a loud chart call. It should test the setup, not bless it.
Start with the basics. Name the asset, timeframe, support zone, and invalidation level. Then ask whether the market has actually changed, or whether price merely bounced after falling too far too fast.
Use this checklist before adding risk:
The final question is the most useful one. If you know what proves the local bottom wrong, you can size the trade or entry around that risk. If you do not know, the position can drift from plan to hope without asking permission.
For spot buyers, the checklist can support smaller staged buys. For traders, it can define whether the bounce has enough structure to enter. For everyone, it should reduce the urge to buy because a chart account posted a green arrow.
No checklist confirms a bottom by itself. It helps you avoid acting before the setup has done enough work.
Local bottom language sits near several other trader terms. Knowing the difference helps you read market posts without absorbing every confident call as truth.
A top signal is the opposite idea. It is evidence that upside momentum may be weakening or buyers may be getting too crowded. The same caution applies to top signals: they are clues, not guarantees.
A swing low is the chart term for a low point between two higher points. A local bottom is often a swing low with trader commentary wrapped around it. The chart pattern may be simple. The internet will still find a way to make it theatrical.
Capitulation describes panic selling or forced exits after a painful decline. It can appear near a local bottom because sellers finally hit the eject button. But capitulation alone does not prove demand has returned.
Dead-cat bounce is the rude label for a rebound that fails. It is useful because it reminds users that relief can happen inside weakness. A market can bounce enough to hurt shorts and still roll over afterward.
These terms work best when they sharpen the same question: is the market showing repair, or just reacting after a hard fall?
After a local bottom call, start by shrinking the claim. A smaller claim is easier to test and harder to abuse.
Ask whether the call applies to Bitcoin, the whole crypto market, or the specific asset you hold. Then match the timeframe to your actual plan. A 4-hour local bottom may help a trader. It may mean very little to someone building a multi-month position.
Next, separate the chart from your exposure. A clean bounce is less useful if you already hold too much of the same asset, bought higher, or need cash soon. A local bottom should help you plan risk, not pressure you into defending an old position.
Before acting, run through the practical next steps:
Then decide what would make you do less. That could be a failed reclaim, weak volume, fresh macro pressure, or Bitcoin losing its own local structure. Planning the exit before the entry keeps a bottom call from becoming a personality test.
The best local bottom calls are useful because they make risk clearer. They do not remove risk. They tell you where the market may be trying to turn, what evidence would support that turn, and where the idea stops working.
That is enough. A local bottom is a clue, not a crown ceremony for the next bull market.
No, a local bottom does not guarantee crypto will go up. It only means price may have found a temporary low on a chosen timeframe.
The next move still depends on confirmation. Price needs to hold the low, reclaim useful levels, and avoid fresh selling pressure. A bounce without follow-through can fail quickly.
No, a local bottom is smaller than a market bottom. It can happen inside a larger downtrend, bear market, or long correction.
A market bottom usually needs broader confirmation across major assets, liquidity, sentiment, and time. Local bottoms can happen many times before a full cycle low is clear.
Indicators that can help confirm a local bottom include support holds, higher lows, volume, RSI divergence, funding resets, open interest flushes, and on-chain stress metrics.
None of them works alone. The better setup combines chart structure with positioning, liquidity, and a clear invalidation level.
Yes, Bitcoin can make a local bottom while altcoins keep falling. Liquidity often returns to deeper assets before riskier coins recover.
Some altcoins also face scheduled supply releases, thin order books, weak narratives, or seller overhang. A Bitcoin bounce can improve mood without saving every chart.
No, a double bottom is not always a local bottom. It is only a possible bottom pattern that needs confirmation.
The pattern becomes more useful when price retests a similar low, holds it, and breaks above the middle bounce. If price loses the second low, the pattern failed.
Beginners should not buy only because someone calls a local bottom. The call is a prompt to check evidence, not a trade instruction.
A cleaner response is to identify the timeframe, support zone, confirmation clues, invalidation level, and position size. If that feels like too much work, the setup is probably too vague.