Physical Address
304 North Cardinal St.
Dorchester Center, MA 02124
Physical Address
304 North Cardinal St.
Dorchester Center, MA 02124


A clear guide to Bitcoin CDD without whale-panic shortcuts.
In crypto, coin days destroyed measures how much crypto moved on a blockchain and how long those coins had sat untouched.
The metric is most useful on Bitcoin, where old coins can sit dormant for years before moving again. Traders watch CDD because it can show when long-term holders, custodians, exchanges, or very old wallets finally spend coins.
Do not read coin days destroyed as a whale-sale alarm. It is an old-coin movement signal, and old coins can move for boring reasons too. The useful part is knowing what the chart can show, what it cannot show, and which second checks stop one candle from becoming a full-blown prophecy.
Coin days destroyed means older, larger coin movements count more than fresh, routine movements. The metric tries to separate meaningful old-supply activity from ordinary transaction noise.
A coin day is one unit of coin value held for one day. If coins sit still, they keep building coin days. When those coins move, the stored age gets counted as destroyed. Nothing is burned. No supply disappears. The “destroyed” part only means the age counter resets after the spend.
The word “destroyed” trips up beginners because crypto already uses “burned” for coins sent out of circulation. CDD is different. It does not reduce supply, change balances by itself, or punish the holder. It just records how much old coin age was spent in a transaction.
The pattern is simple:
This is why CDD appears in Bitcoin market reports. A small wallet moving new BTC barely moves the metric. A long-dormant wallet moving a large output can dominate the day. That can help, but it also invites dramatic storytelling. Old coins moving is information. It is not a confession.
For a beginner, the main boundary is motive. CDD can show that coin age was spent, but it cannot show whether the holder sold, moved collateral, cleaned up wallet structure, or shifted custody.
That boundary keeps the metric useful. Read CDD as a prompt for better questions, not as a verdict. The chart points toward old supply movement. The next step is checking where the coins went and what the market did afterward.
Coin days destroyed is calculated by multiplying the amount of coins moved by how many days those coins had stayed unmoved. The result is an age-weighted measure of spent coin value.
The ChainQuery CDD report frames the metric around spent inputs. On June 20, 2026, it showed 57,622,939,320 BTC-days destroyed across its covered Bitcoin range. That is why CDD fits Bitcoin-style accounting: Bitcoin tracks outputs that are created, held, and later spent.
Here is the plain version before dashboards make it look mystical:
| Example Movement | CDD Created |
|---|---|
| 1 BTC moved after 100 quiet days | 100 coin days destroyed |
| 0.5 BTC moved after 200 quiet days | 100 coin days destroyed |
| 1 BTC moved after 1 quiet day | 1 coin day destroyed |
The first two examples create the same CDD because the smaller coin amount had twice the age. The fresh movement creates almost nothing. It moved the same amount as the first example, but it had barely any stored age.
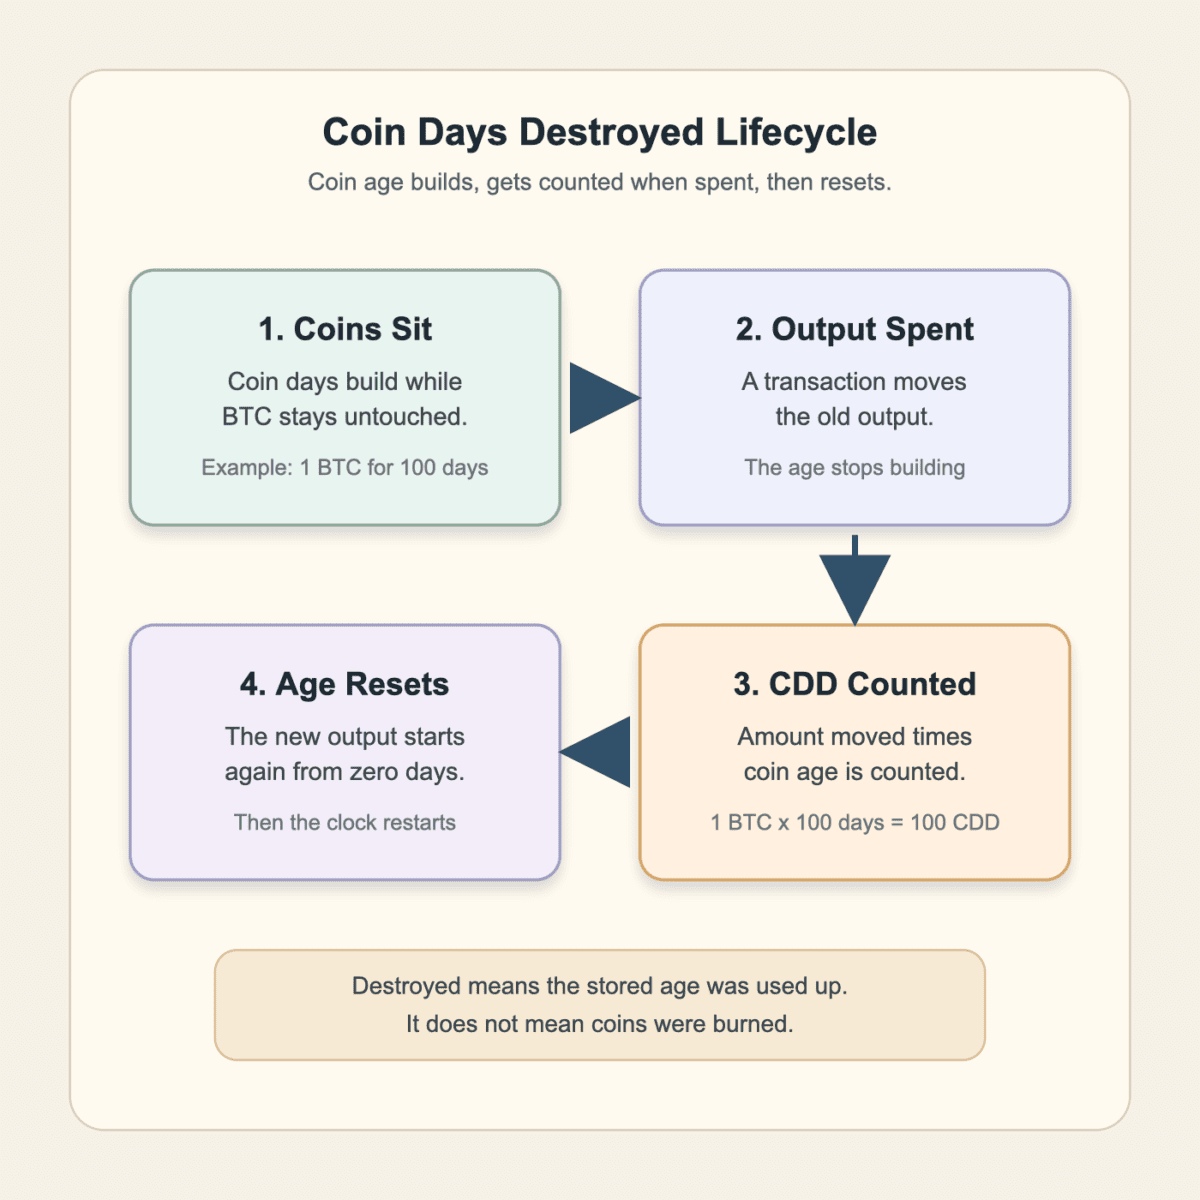
Old whales, cold wallets, and dormant supply get attention in CDD charts for this reason. The metric is not asking, “How much moved today?” It asks, “How much long-sitting value finally moved today?”
This also explains why one daily bar can be noisy. A single operational move can produce a large reading. Moving averages, supply-adjusted views, and exchange-specific versions help smooth that noise, but they do not remove the need for context.
Coin days destroyed is mostly a Bitcoin metric because Bitcoin uses UTXOs, or unspent transaction outputs. Each output has a clean history: it was created, it sat untouched, then it was spent.
That structure makes coin age easier to measure. If an output holds BTC for months, then gets spent, analysts can calculate how much age was consumed. Bitcoin’s accounting model gives CDD one clean object to track.
Account-based chains can still have age-style analytics, but the mapping is less direct. Exchange ledgers, wrapped assets, custodial records, and smart-contract balances can blur the clean “this output sat still, then moved” story. Someone may trade repeatedly inside an exchange without creating the same visible on-chain pattern.
The Bitcoin-first setup also changes interpretation. CDD often gets used to study dormant supply, long-term holders, and cycle behavior. That does not mean every coin with a blockchain can support the same conclusion.
Use this split before comparing charts:
So “coin days destroyed in crypto” is the broad phrase, while “coin days destroyed in Bitcoin” is the cleaner use case. If a dashboard applies a similar idea elsewhere, check how the chain records balances before importing Bitcoin-style conclusions.
High coin days destroyed can signal that long-dormant coins have moved. That can matter because old coins often belong to patient holders, early buyers, large custodians, or wallets that rarely transact.
The bullish or bearish meaning depends on where those coins go and what else is happening. A spike during a fast rally may look like long-term holders distributing into strength. A spike into known exchange addresses can raise selling-pressure concerns. A spike tied to bankruptcy, government movement, custody migration, or wallet consolidation may be more about administration with a chart attached.
That is why CDD often appears near cycle-top debates. A real top signal needs more than one old-wallet movement. Price extension, realized profit, exchange inflows, liquidity, and sentiment all shape the reading.
High CDD can point you toward several possibilities:
Markets usually react to the scary version first. “Old coins moved” becomes “whales are dumping” in about three social posts. Sometimes that fear is useful. Often it is too fast.
The useful takeaway is narrower. High CDD tells you to investigate old-coin movement. It does not tell you the sender’s intent, the final buyer, or whether the market has already absorbed the flow.
Low coin days destroyed can signal that older coins are staying dormant. Traders often read that as long-term holders refusing to sell, especially after heavy distribution or during a quiet market.
That context can help. If old coins stop moving while price stabilizes, the market may have less long-held supply coming to the chain. But low CDD can also mean on-chain activity is quiet, activity has shifted to exchanges or custodians, or most movement comes from fresh coins and short-term churn.
This is where “supply exhaustion” claims need care. Low CDD can support a bottom signal argument, but it cannot make that argument alone. A bottom also needs demand, liquidity, price acceptance, and fewer forced sellers. Dormant coins are only one part of that picture.
Low CDD is most useful beside other checks:
The danger is flipping the high-CDD mistake upside down. High CDD does not automatically mean bearish selling. Low CDD does not automatically mean bullish supply shock. It means older coins are not showing much movement on that chain during that window.
For a trader, the right response is patience. Low CDD can tell you old supply is quiet. It cannot tell you new demand is strong enough to move price.
Coin days destroyed differs from transaction volume because it weights movement by age. Transaction volume asks how much moved. CDD asks how much old value moved.
That one difference changes the kind of question each metric answers. A large amount of fresh BTC can create high transaction volume with low CDD. A smaller amount of very old BTC can create a noticeable CDD reading. Neither chart is “right” by itself. They answer different questions.
The dashboard stack gets easier when each metric has a job to do:
| Metric | What It Adds |
|---|---|
| Transaction Volume | Shows the size of on-chain movement without caring how old the coins are. |
| Coin Days Destroyed | Highlights old or large spent outputs by weighting movement with coin age. |
| HODL Waves | Shows how supply is distributed across age bands before or after movement. |
| SOPR | Helps estimate whether spent outputs moved at a profit or loss. |
| Realized Profit | Shows profit actually locked in by coins that moved on-chain. |
The most useful readings often combine these views. A CDD spike plus rising realized profit can look more like old holders selling into gains. A CDD spike without matching exchange inflow is harder to read. A HODL-wave shift can show whether age bands are changing over time rather than reacting to one loud day.
SOPR is especially helpful because CDD does not know profit or loss by itself. It only knows age-weighted movement. If old coins move at a profit, the market interpretation changes. If they move between cold wallets, the price story may be much weaker.
More charts are not the goal. Each chart needs a narrow job. CDD is strong at old-coin movement. It is weak at intent.
Coin days destroyed can mislead traders when old-coin movement gets mistaken for guaranteed selling. The chart can show activity, but it cannot read the wallet owner’s mind.
Cold-storage cleanup is the classic trap. A holder may consolidate old UTXOs, rotate keys, split funds across new wallets, or move coins to a different custody setup. That can create CDD without creating immediate market sell pressure. A wallet move is not always a market exit.
Wallet context helps here. If the signal appears during a known storage migration, the useful question is about wallets and custody flow, not panic. If the same old coins move straight toward exchange-linked addresses, the selling-pressure question becomes more serious.
CDD can also create false drama through several blind spots:
Distribution risk is still real. If old coins move toward liquidity while price is extended and social sentiment is euphoric, a CDD spike can strengthen an exit liquidity concern. The mistake is jumping there before checking the path.
Use a false-signal checklist before reacting:
CDD is a good smoke alarm for old supply movement. It is not the fire report, the insurance claim, and the investigator in one chart.
Coin days destroyed has several variants because raw CDD can be noisy and hard to compare across time. Different dashboards adjust, smooth, or translate the metric for different questions.
The main reason is network age. As Bitcoin gets older, more outputs can accumulate long stretches of coin age. A raw CDD reading from an early cycle may not compare cleanly with a raw reading years later. Supply adjustment and binary readings try to make that problem easier to handle.
Here is the translation layer:
| Metric | Plain-English Use |
|---|---|
| Supply-Adjusted CDD | Scales CDD against available supply so older network history is easier to compare. |
| Binary CDD | Turns CDD into a simple high-or-low reading against a chosen threshold. |
| Dormancy | Compares coin days destroyed with transaction volume to estimate average spent age. |
| Liveliness | Tracks the relationship between coin days created and coin days destroyed over time. |
| VDD | Weights destroyed coin days by market value, often for cycle-momentum analysis. |
| CVDD | Uses cumulative value coin days destroyed in a valuation-style model. |
These metrics are related, but they are not interchangeable. Binary CDD can simplify a noisy series, but the threshold choice matters. Supply-adjusted CDD can improve long-term comparison, but it still cannot prove why coins moved. VDD and CVDD bring price or valuation framing into the picture, which changes the question.
Dashboard formulas can also vary. Some use daily readings. Some use moving averages. Some smooth aggressively. Some focus on exchange inflow CDD rather than generic network CDD. A screenshot without its settings is only half an argument, even if it is wearing a chart costume.
The useful habit is to name the exact metric before drawing the conclusion. “CDD spiked” is less precise than “exchange inflow CDD rose with realized profit.” The second statement gives you something to verify.
Use coin days destroyed as a context tool, not as a standalone trade trigger. The metric is best at telling you when old supply moved, then pushing you to verify what kind of movement it was.
Start with the shape of the move. A single daily spike can come from one large transaction. A rising moving average suggests broader old-coin activity. A high exchange-inflow CDD reading is more directly tied to potential selling than generic CDD, but labels and final flows still need a second look.
Then compare the CDD signal with the market setup:
| CDD Signal | What To Verify Next |
|---|---|
| One-day spike | Check wallet path, exchange labels, and known operational events. |
| Rising trend | Compare realized profit, SOPR, HODL waves, and price structure. |
| Low sustained CDD | Check whether demand, volume, and exchange flows support dormancy claims. |
| Exchange-inflow CDD spike | Look for matching sell pressure, liquidity absorption, and follow-through. |
Long-term-holder behavior also needs a time horizon. A strong holder may move coins for planning, security, or rebalancing without abandoning the thesis. If you are studying a conviction play, CDD can show whether old supply moved. It cannot tell you whether the move was disciplined or emotional.
Cycle context matters too. Around a BTC ATH, old-coin movement can carry more market weight because holders may finally be in deep profit. During a flat or distressed market, the same CDD behavior can mean something else. Price location changes how the signal reads.
A useful reading process is simple:
If the answer still feels unclear, that is a result. CDD often tells you when to investigate, not when to click buy or sell.
Start with the formula before the chart. Once you know that CDD equals coin amount multiplied by time held, the spikes become less mysterious and less tempting to overread.
Then open a chart that lets you view moving averages or supply-adjusted versions. A raw daily CDD bar can be useful, but it is usually too jumpy for serious interpretation. The trend matters more than the loudest candle.
Use this order when you first study CDD:
On the first pass, ignore heroic screenshots and exact threshold claims. Ask one boring question instead: does the CDD move still look meaningful after you add the time window, exchange-flow view, and price reaction?
If you use a dashboard, check the settings before sharing the chart. Daily CDD, moving-average CDD, supply-adjusted CDD, Binary CDD, and exchange-inflow CDD can all point at different questions. A clean label prevents a lot of noisy debate.
Keep CDD in its lane. It is excellent at showing old on-chain value moving again in real use. It is poor at proving motive, timing entries, or explaining every market move.
That makes coin days destroyed useful for Bitcoin investors who want better signal literacy. It helps you ask sharper questions before the crowd turns one old-wallet transaction into a market obituary.
No. Coin days destroyed does not mean Bitcoin is burned or removed from supply. It means the accumulated coin age is counted when coins move, then the new output starts aging from zero.
High coin days destroyed can be bearish when old coins move toward exchanges during weak market structure or heavy profit-taking. It can also come from custody changes, wallet cleanup, or other operational moves, so it needs confirmation.
Low coin days destroyed can support a bullish read when older holders stay dormant and demand is improving. It is not bullish by itself because quiet on-chain activity or off-chain trading can create the same surface reading.
Coin days destroyed can show that old or large coins moved, which may include whale activity. It cannot prove whales are selling unless the wallet path, exchange inflows, realized profit, and price reaction support that conclusion.
Traders use supply-adjusted coin days destroyed because raw CDD gets harder to compare as Bitcoin ages. The adjusted version helps put old-coin movement into broader supply context.
Coin days destroyed works cleanly on Bitcoin-style UTXO assets. Other cryptocurrencies may need different age or activity metrics, especially when accounts, smart contracts, custodians, or exchange ledgers blur the output history.