Physical Address
304 North Cardinal St.
Dorchester Center, MA 02124
Physical Address
304 North Cardinal St.
Dorchester Center, MA 02124


A plain-English guide to net issuance, burns, inflation, and crypto supply risk.
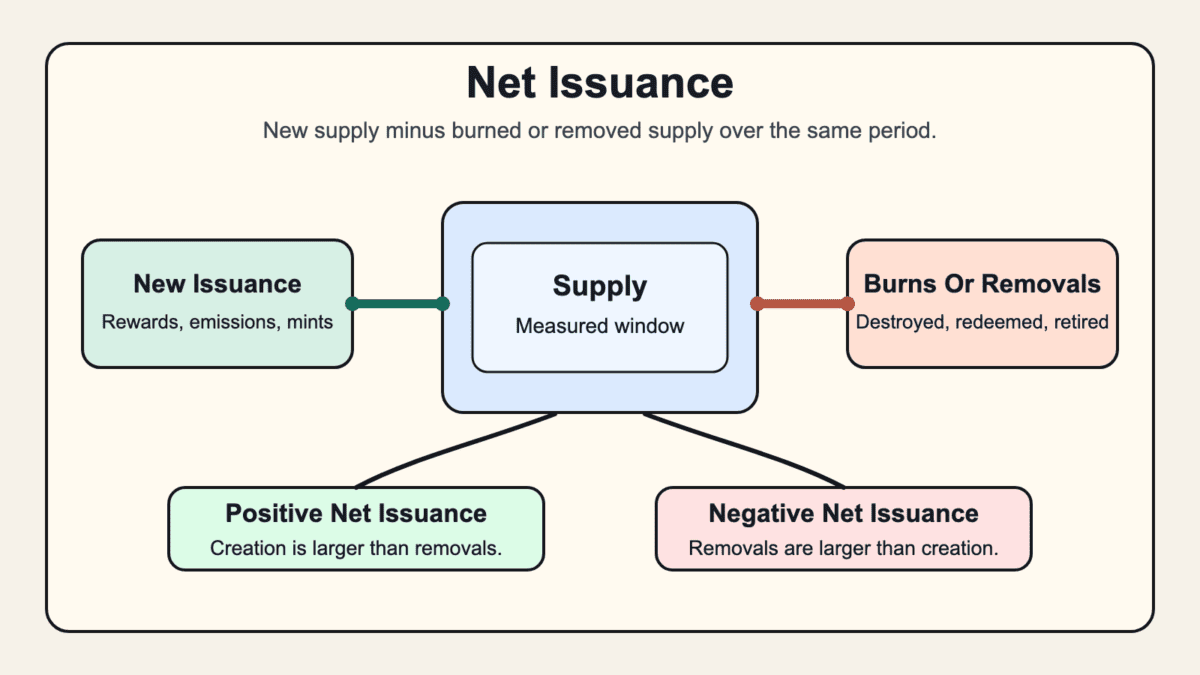
Net issuance is the net change in token supply after newly created units are offset by units removed during a chosen period.
The term is useful because crypto supply rarely moves in one clean direction. A network can pay validators with newly issued tokens while burning fees, or a stablecoin issuer can mint new tokens while destroying redeemed ones. Net issuance puts those opposite flows into one number, then forces the obvious follow-up: over what period?
Net issuance in crypto is a supply-flow metric that shows whether token supply grew or shrank after creation and removals are counted in the same window. It answers a narrower question than most supply debates: did more units enter supply than leave?
That sounds simple. It gets noisy because crypto has several supply machines running at once. Proof-of-stake networks may issue new tokens to validators. Some chains burn part of transaction fees. Token projects may run buyback-and-burn programs. Stablecoin issuers may mint and redeem supply as users move money in and out.
That is why net issuance is most useful as a flow check, not as a whole tokenomics verdict. It can show whether the supply base expanded this week, month, or year. It cannot show who can sell next, whether demand is rising, or whether a headline burn actually offsets every other source of new supply.
Use a small example before the dashboards arrive:
That same-period rule does a lot of work. Mixing monthly issuance with annual burns creates bad math with a clean-looking chart. One-day readings can also look dramatic when activity spikes or fees collapse.
So the clean reading is not “supply good” or “supply bad.” It is a dated measurement of net supply change. From there, you can ask whether the number is large enough to affect holders, markets, incentives, or the story people are selling.
Net issuance works by subtracting supply removed during a period from supply created during that same period. The formula is direct:
Net issuance = gross issuance - burns or removals
Gross issuance means new tokens created by protocol rules, validator rewards, mining rewards, emissions, grants, or minting. Burns or removals are tokens destroyed, redeemed, retired, or otherwise taken out of the relevant supply count.
The period is the part people skip when the chart looks exciting. Daily net issuance can flip because fees surged for a few hours. Monthly net issuance can show a smoother pattern. Annualized net issuance can help with scale, but it assumes the current pace continues.
Use that assumption carefully.
Use these checks before trusting a quoted number:
Crypto slang can also muddy the accounting. A post saying “printer on” may mean macro liquidity, easy profits, stablecoin minting, or new token supply. Precise supply math beats printer on language when you are checking an actual token claim.
Net issuance is not the same as gross issuance, inflation, or circulating supply. These terms sit near each other, but each answers a different supply question.
Gross issuance counts what was created. Net issuance subtracts what was removed. Inflation rate turns supply change into a percentage. Circulating supply describes what the market usually counts as available, although methodology varies by tracker.
The table below separates the terms without pretending they are interchangeable.
| Term | What It Tells You |
|---|---|
| Gross issuance | How many new units were created during a period. |
| Burns or removals | How many units were destroyed, redeemed, or retired. |
| Net issuance | Whether supply grew or shrank after creation and removals. |
| Inflation rate | Net supply change compared with a chosen supply base. |
| Circulating supply | The supply counted as available to the market. |
| Token unlocks | Locked tokens becoming transferable or tradeable. |
Token unlocks deserve their own warning. An unlock can increase circulating supply pressure even when it is not new protocol issuance. The tokens may already exist, but they were not previously able to move or sell. That is why net issuance alone can miss a messy launch schedule when large investor, team, or treasury unlocks approach.
The cleaner habit is to layer the terms: calculate net issuance, compare it with circulating supply, then check unlock schedules, staking rewards, and real demand. Supply analysis works better when each metric keeps its own job.
Net issuance can turn negative when burns, redemptions, or removals are larger than new token creation over the same period. In plain English: more supply left than arrived.
Ethereum is the cleanest example because it has both validator issuance and fee burn. Validators receive newly issued ETH. A portion of transaction fees can be burned. Ethereum.org’s Merge issuance page says the transition reduced annual ETH issuance by about 88.7%, with execution-layer issuance dropping to zero while consensus-layer rewards continued.
Several forces can change net issuance:
A negative reading does not mean the number stays negative forever. It can change when network activity changes, fee markets cool down, staking participation moves, or protocol rules shift. Lower fees can be good for users while also reducing burn pressure. Crypto rarely lets one group have a perfectly clean slogan.
Negative net issuance is useful because it shows that removals beat creation in that window. It is less useful when people turn it into a permanent label. A token can be negative this week, positive next month, and still need demand to support price.
Net issuance means different things across crypto models because supply changes come from different sources. Ethereum, Bitcoin, Solana-style networks, and stablecoins do not run the same supply machine.
Ethereum has validator issuance and fee burns, so net issuance can be positive or negative depending on activity and rewards. Bitcoin has scheduled block subsidy issuance and no equivalent base-fee burn mechanism. Solana-style debates often focus on staking rewards, inflation, and whether stakers maintain their relative share better than passive holders. Stablecoins need a separate lens because their net issuance often means mints minus burns or redemptions, not native-token validator rewards.
Here is the clean comparison.
| Model | What Net Issuance Means There |
|---|---|
| Ethereum | Newly issued ETH minus ETH removed through fee burn over a period. |
| Bitcoin | Scheduled new BTC issuance, with no similar protocol fee-burn offset. |
| Solana-style networks | Reward issuance, fee mechanics, staking participation, and dilution debates. |
| Stablecoins | Minted supply minus burned or redeemed supply during a period. |
The comparison helps because many supply arguments borrow Ethereum language and paste it onto everything else. That can mislead. A burn-adjusted ETH chart, a Bitcoin issuance schedule, a staking APY debate, and a USDC mint flow are related, but they are not the same accounting problem.
For holders, the key issue is who receives the new supply and who absorbs any dilution. Stakers may earn rewards that offset some supply growth. Non-stakers may see their relative share fall. Stablecoin users may read net issuance as a demand or redemption signal, not as an inflation rate. So compare models before comparing numbers, because a lower-looking net issuance number is only meaningful when the mechanics match.
Net issuance can reduce or increase supply pressure, but it does not prove price direction. It is one input into market behavior, not a trade signal wearing a lab coat.
Negative net issuance can help if demand holds steady or rises. Fewer net new tokens can mean less supply for the market to absorb. But demand, liquidity, market depth, borrowed exposure, and attention decide whether that cleaner supply backdrop becomes a price move.
The useful reading is narrower: net issuance tells you whether supply pressure from creation was offset by removals. It does not prove buyers are waiting, order books are deep, or holders are patient. A token can have clean supply math and still trade badly if the market no longer wants the asset.
Price interpretation needs a few separate checks:
Supply stories also spread fast. A low-issuance claim can turn into a market slogan before enough users check the math, and that can leave late buyers as exit liquidity if earlier holders sell into the narrative.
The reverse is also true. Positive net issuance is not automatically fatal if usage, revenue, fees, staking demand, or real buyers absorb new supply. During market rotation, money can leave one sector for another even when the first sector has cleaner issuance. Supply is the starting question. Flows decide whether the answer shows up on the chart.
Checking net issuance means rebuilding the claim from its inputs before you repeat it or trade on it. The goal is to avoid buying a slogan with missing math.
Start with the period, then separate issuance from removals. A project can show a one-day burn spike, annualize it, and make the supply story look cleaner than it is. New issuance may come from validator rewards, mining rewards, token emissions, incentive programs, treasury releases, or mint permissions. Removals may come from fee burns, buyback burns, redemptions, or contract rules.
Use this checklist before trusting the claim:
Staking rewards need special care. A high reward rate can help stakers maintain their relative share, but it may still mean new supply exists. The reward is not free yield for everyone. Someone is receiving new units, and non-stakers may be diluted.
Net issuance should support a broader holding thesis, not replace it. If a token claim depends on low issuance, connect that claim to actual usage, demand, liquidity, and risk controls. The clean final check is blunt: would the argument still make sense if the chart were flat for six months?
Related concepts help you keep net issuance in the right box. Gross issuance is the creation side before burns, while burn rate is the speed of supply removal. Token unlocks make existing locked supply transferable. Dilution describes a holder’s relative share shrinking, FDV uses a broader supply assumption than market cap, and circulating supply is the supply counted as available.
Two follow-up ideas are especially useful. A low-issuance claim can become a supply narrative when traders start treating the metric as a story. And if the metric becomes part of a conviction play, it should support the thesis instead of becoming the whole thesis.
Fully diluted valuation and circulating supply can change the read when net issuance looks calm but future float is still waiting offstage. That is why a quiet net-issuance chart can still hide a loud unlock calendar.
Keep the terms separate when reading tokenomics. Net issuance tells you the net supply-flow result during one period. It does not tell you every future release, every sellable wallet, or every buyer’s willingness to absorb supply. That is why supply work is layered, not one magic percentage with a confident font.
Net issuance in crypto is the amount of new token supply created minus the amount removed during the same period. It is most useful when a token has both issuance and burns, or when a stablecoin has mints and redemptions. The key is matching the time window before comparing the flows.
Yes, net issuance can be negative when burns, redemptions, or removals exceed new supply creation during the same period. Ethereum can show this during periods when fee burn is larger than validator issuance. The reading is period-specific, so a negative week does not prove a permanently shrinking supply.
No, negative net issuance does not guarantee a price rise. It can reduce supply pressure, but price also depends on demand, liquidity, market depth, borrowed exposure, unlocks, and sentiment. If demand fades, a shrinking or slower-growing supply can still fail to support price.
Net issuance is not the same as inflation. Net issuance is the absolute supply change after creation and removals. Inflation rate expresses that change as a percentage of a supply base over time. The inflation number depends on the denominator and the period used.
Staking can offset net issuance for a staker’s relative share, but it does not make issuance disappear. If new tokens are paid to validators or delegators, supply may still grow. Stakers may receive part of that growth, while passive holders may absorb more dilution.
Token unlocks do not always count as net issuance because the tokens may already exist. An unlock can still increase circulating supply or sell pressure when locked tokens become transferable. That is why you should check unlock schedules alongside net issuance instead of treating them as the same metric.
Start with net issuance as a basic supply check, then build around it. The useful habit is not memorizing one chart. It is asking whether creation, removals, unlocks, and demand are being measured honestly.
Use net issuance like a balance check. First confirm the inputs, then decide whether the result is meaningful for the asset in front of you. A stablecoin redemption flow, an ETH burn window, and a staking-reward schedule can all produce supply numbers, but they answer different market questions.
Run the same small process each time:
This keeps the metric useful without turning it into a prophecy. Net issuance can expose weak supply claims, especially when projects shout about burns while new tokens keep arriving elsewhere.
If the claim still looks strong, write down what would weaken it. Lower fees can reduce burns. Higher reward issuance can change the balance. Unlocks can add sell pressure even when net issuance looks tidy. That small pause keeps the number useful instead of turning it into a slogan with a decimal point.
When the number looks bullish, slow down. Ask who receives new supply, who can sell soon, and whether real demand is absorbing the flow. That is where the cleaner decision usually starts.