Physical Address
304 North Cardinal St.
Dorchester Center, MA 02124
Physical Address
304 North Cardinal St.
Dorchester Center, MA 02124

Dune dashboard explained for safer on-chain research.
A Dune dashboard is a shareable page of on-chain charts, tables, and metrics built from Dune queries. It turns blockchain activity into a research page you can read, share, and sanity-check.
You usually meet one as a link in a protocol update, X thread, Discord chat, fund memo, or token research post. A good one helps you inspect real blockchain activity. A weak one can make a narrow metric look like a finished argument.
A clean graph is useful. A clean graph with bad assumptions is still bad research, just better dressed.
A Dune dashboard is a public or private research page that displays blockchain data through visual widgets. Those widgets can be charts, tables, counters, written notes, embedded context, and links to the queries behind the numbers.
That makes it different from the broader Dune platform. Dune is the analytics environment. A query is the SQL-based request for data. A dataset or table is the indexed blockchain information being queried. A dashboard is the readable page where those outputs come together.
Here is the clean split:
| Dune Term | What It Means |
|---|---|
| Dune | The analytics platform for querying on-chain data. |
| Query | The SQL request that pulls and shapes data. |
| Visualization | A chart, table, counter, or graph made from query results. |
| Dashboard | A page that collects visualizations and notes around a topic. |
That split helps because users often mistake a dashboard for a source of truth. It works better as a research layer. The page can organize evidence, but the evidence still comes from underlying data, query choices, and assumptions.
Dune is also not an exchange, wallet, tax app, block explorer, or trade executor. It does not custody funds. It does not route swaps. It does not know whether you should buy a token because a line went up.
The useful role is narrower: a Dune dashboard helps you ask better questions about on-chain behavior before you accept a chart screenshot as proof.
A Dune dashboard works by turning raw blockchain activity into structured data, then turning query results into visual blocks. The dashboard is the final display layer, not the whole machine.
The flow starts with transactions, contract calls, transfers, swaps, mints, burns, bridge events, wallet activity, and other on-chain records. Dune indexes that activity into tables. Analysts then write queries that filter, join, count, group, and label those records for a specific question.
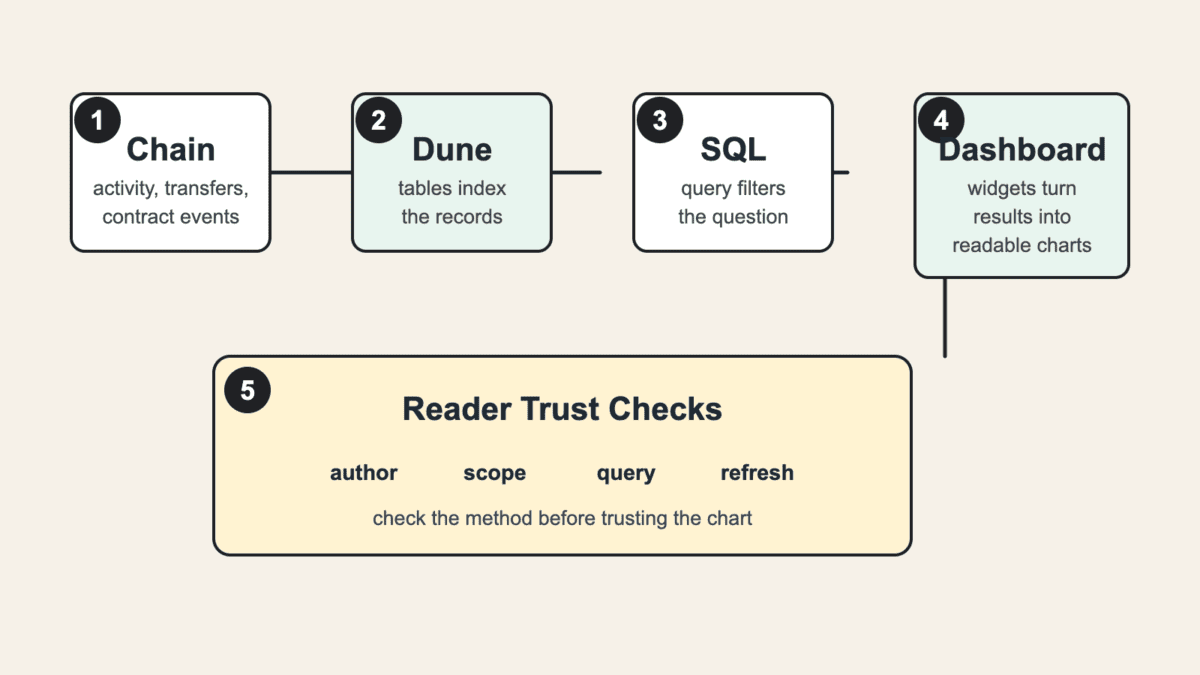
Dune Docs describes the platform as indexing 100+ blockchains. That breadth is why one Dune dashboard can cover a narrow contract or a broad cross-chain activity view. The same documentation covers the mechanics too: creating dashboards, adding widgets, using text blocks, embedding images, keeping pages updated, and sharing the result.
For a beginner, the point is not to memorize every menu. It is to understand how many choices sit behind one neat chart.
Those choices include:
The dashboard builder can be a community analyst, protocol team, fund, developer, trader, data service, or curious user with enough SQL patience. Some dashboards are careful public goods. Some are marketing pages. Some are abandoned notebooks that still look official because the page is neat.
So the page itself is only the beginning. A useful Dune dashboard lets you inspect the author, open the query when available, check the table sources, and compare the output with another source. If those checks are hidden, stale, or confusing, the chart should lose authority fast.
Crypto traders and investors use Dune dashboards to turn blockchain activity into research questions. A dashboard can support a thesis, challenge a claim, or reveal a metric worth checking elsewhere.
Protocol followers might inspect fees, active wallets, retention, bridge flows, DEX volume, treasury activity, token supply movement, or L2 usage. DeFi users may compare vault deposits, liquidity changes, borrower activity, liquidations, or reward flows. NFT and meme-coin traders may inspect mints, holders, wallet clusters, top buyers, and launch activity.
Dashboards also travel through social feeds. When CT passes a dashboard around, the useful question is not “does the chart look smart?” It is “does this metric actually prove the claim attached to it?”
Here are common research jobs:
| Research Question | Dashboard Signal To Inspect |
|---|---|
| Is a protocol being used? | Active wallets, transactions, fees, and repeat usage. |
| Is volume healthy? | DEX volume, unique traders, pool depth, and outliers. |
| Are holders changing? | Holder concentration, top-wallet movement, and fresh wallets. |
| Is an L2 gaining activity? | Transactions, users, fees, bridge flows, and app-level usage. |
| Is a token launch organic? | Early wallets, buy-sell flow, liquidity, and wallet clustering. |
| Is a narrative heating up? | Usage, flows, and volume across related contracts or chains. |
Those signals are research inputs, not buy buttons. A Dune dashboard can show that a chain has more activity, a protocol has more fees, or a token has changed holder distribution. It cannot tell you whether the activity is durable, fairly priced, or already late.
That warning gets sharper in meme-coin trenches, where a dashboard screenshot can become social proof before anyone checks liquidity depth or wallet relationships. Fast markets reward fast reading, but they punish lazy certainty with admirable efficiency.
The best use is a research loop. Start with the dashboard, write down the claim it seems to support, then verify the fragile parts. If the chart says users are growing, check whether those users are unique wallets, repeated bot actions, airdrop farming, or a narrow contract subset. The chart starts the work. It should not end it.
Read a Dune dashboard by checking whether the chart supports the exact claim being made. If the claim is bigger than the metric, the dashboard is being asked to carry too much weight.
Start with the author. A dashboard from a protocol team may be accurate, but it can still choose flattering metrics. A dashboard from an independent analyst may be sharper, but it can still have stale queries or hidden assumptions. Author quality helps, but it does not replace inspection.
Then check freshness. Look for the last refresh time, query state, date range, and whether the page covers the period being discussed. A dashboard about current activity that last refreshed weeks ago is not current evidence. It is a fossil with a nice legend.
Use this checklist before trusting the takeaway:
Scope is where many bad reads begin. A dashboard may track one contract while the protocol uses several. It may track Ethereum but ignore Base, Solana, Optimism, or another chain where activity moved. It may count transactions while the useful question is unique wallets, fees, liquidity, or retained users.
Holder and liquidity dashboards need extra caution. If a chart shows supply moving from early wallets to public buyers, that may support an exit liquidity check. But it still needs context: pool depth, venue, token age, wallet links, distribution, and whether selling pressure is actually visible.
Filters can also make a dashboard too flattering. A query may remove failed transactions, exclude tiny trades, smooth spikes, ignore certain pools, or count a wallet as “active” after one minor action. Those choices can be valid. The problem starts when the dashboard title hides them.
Price data adds another layer. A USD chart may depend on a price table, token mapping, or sampling method. Thin tokens can have unreliable prices, and bridged assets can create awkward labels. If the dollar value looks dramatic, inspect the token unit and price source before retweeting the number into a small fire.
One practical example: a dashboard claims a token has “strong holder growth.” The chart may be true if it counts new wallets. But those wallets could be tiny airdrop hunters, bundled buyers, exchange deposit addresses, or related wallets split for optics. The careful note is narrower: “holder count rose by this query’s method.” That is less exciting. It is also less expensive.
You do not need SQL to read many public Dune dashboards. You need SQL when you want to inspect custom logic, fork a query, or build original analysis with confidence.
For most beginners, the first level is browsing. Search for a protocol, chain, token, analyst, or metric. Open a public dashboard. Read the title, author, refresh timing, notes, date range, and chart labels. Then compare the output with another dashboard, explorer, or protocol page.
The learning path has three levels:
The second level is where Dune gets more useful. Query inspection shows what the dashboard counted, what it excluded, and whether the visible chart matches the method. You may not understand every line at first. But even noticing table names, contract addresses, filters, and date ranges can prevent a weak read.
Custom work usually needs SQL, DuneSQL familiarity, and enough blockchain context to avoid nonsense. A query can run and still answer the wrong question. That is the quiet danger of data tools: the interface looks precise even when the metric is not.
So the honest answer is split. Beginners can use Dune dashboards without coding. Serious original research often needs SQL or help from someone who can review the query. If money depends on the conclusion, “I liked the chart” is not a method.
A Dune dashboard is best when you need a custom, reusable, on-chain answer. Other crypto research tools can be better when the job is price action, transaction verification, labeled wallet intelligence, portfolio tracking, or instant alerts.
That distinction prevents tool confusion. Dune can be excellent for checking protocol usage, bridge flows, token events, L2 adoption, or custom wallet cohorts. It is not always the fastest way to read a fresh token chart, verify one transaction, monitor your portfolio, or receive a real-time webhook.
Use the tool that matches the question:
| Tool | Best Use |
|---|---|
| Dune dashboard | Custom on-chain metrics, public analysis, and reusable research pages. |
| DeFiLlama | Prebuilt DeFi, TVL, fee, revenue, stablecoin, and chain aggregates. |
| Nansen | Labeled wallet intelligence and entity-driven flow analysis. |
| TradingView | Price charts, technical analysis, and market structure. |
| Dexscreener | Live DEX pairs, liquidity, token pages, and fast market discovery. |
| Block explorer | Transaction-level verification and contract-specific checks. |
| Portfolio tracker | Wallet balances, positions, and personal account visibility. |
| API or webhook tool | Alerts, automation, and faster event-driven workflows. |
This is why Dune can sit in the middle of a research stack. It can explain the “why” behind a claim better than a price chart, while a block explorer can verify one transaction better than a dashboard summary. DeFiLlama may answer a standard protocol aggregate faster. Nansen may help when wallet labels are the central question.
The mistake is asking one dashboard to become every tool. If a Dune dashboard shows rising flows into a protocol, that may support a research note. It should not become an automatic top signal or bottom call. Markets can price in good news early, ignore good data, or punish crowded trades for sport.
The clean workflow is comparative. Use Dune for the custom on-chain question. Use a block explorer for exact transaction checks. Use DeFiLlama for broad protocol aggregates. Use live market tools for current trading conditions. When two sources disagree, slow down and identify the unit, time window, chain scope, and method.
A Dune dashboard cannot prove a token is safe, a team is honest, or a trade will work. It can show on-chain evidence, but evidence still needs interpretation.
The first limit is freshness. Some dashboards refresh often. Others lag, fail, or sit abandoned. A stale dashboard can be fine for historical context, but it is weak support for a current claim about flows, users, volume, or liquidity.
The second limit is visibility. Dune works with on-chain data, so off-chain order books, private exchange balances, OTC flows, internal platform ledgers, market-maker agreements, Telegram coordination, and private investor behavior may sit outside the dashboard. The missing part can change the conclusion.
Keep these limits close:
Rug-risk examples show the boundary clearly. A dashboard may reveal sudden liquidity movement, contract calls, top-wallet selling, or strange holder patterns. That can support a hard rug warning, but it cannot prove intent by itself.
Slow damage is even harder. A dashboard may show gradual liquidity decay, team-wallet movement, holder churn, or declining organic use. Those clues can fit soft-rug warning signs, but the label still needs surrounding evidence.
The same caution applies to trading. A dashboard can show that a wallet bought early, a pool grew, or a protocol gained activity. It cannot tell you whether the edge remains, whether liquidity can absorb your size, whether insiders will sell, or whether the market already noticed.
Use a Dune dashboard as a witness, not a judge. It can describe visible activity. It cannot supply motive, future behavior, or risk management. Very rude of it, but useful to remember.
Start using a Dune dashboard by picking one specific question, not by browsing until a chart feels important. A focused question makes weak dashboards easier to spot.
Good starter questions are narrow. “Is this protocol gaining users?” is better than “is this project good?” “Did liquidity move after the announcement?” is better than “should I buy?” The dashboard can answer measurable questions more cleanly than emotional ones.
Use this simple workflow:
Keep a short research note as you go. Write the dashboard link, the claim you think it supports, the query or metric name, and the main assumption. That note prevents chart drift, where a narrow data point slowly becomes a louder claim than it deserves.
If you are new, spend more time reading than building. Follow analysts who explain their methods. Compare dashboards that disagree. When you find a useful chart, ask what would make it wrong. That one question does more work than a dozen extra tabs.
Dune dashboards sit inside a broader on-chain analytics habit. The useful habit is learning how metrics are built, where scope changes the answer, and when social proof is moving faster than evidence.
Query inspection is the first related concept. It tells you whether a dashboard counted the right contracts, wallets, chains, and periods. Without that inspection, you may be trusting a headline rather than a method.
Wallet behavior is another related area. Dune can help map holder changes, fresh wallet activity, repeated buyers, and whale movement. In meme-coin trenches, those dashboards need careful reading because labels, clusters, and exchange addresses can blur the story.
Social context changes the risk. If a dashboard spreads through CT, check the caption against the query method before the timeline turns it into a trade.
Finally, holder, pool, and token-flow dashboards connect to exit-risk checks. A dashboard can help surface the question. Your next job is checking whether the market can handle exits, whether volume is real, and whether the metric actually maps to tradable depth.
A Dune dashboard in crypto is a shareable page of charts, counters, tables, and notes built from queries over on-chain data. It helps users inspect blockchain activity, but its reliability depends on the query, scope, filters, and refresh timing.
No, you do not need SQL to read many public Dune dashboards. You may need SQL to inspect complex query logic, fork an existing dashboard, or build custom research that answers a new question.
Dune dashboards are reliable only when the query, source tables, scope, and refresh timing fit the claim being made. A dashboard can be useful and still be stale, narrow, promotional, or wrong for the question in front of you.
A Dune dashboard can help surface activity, wallet behavior, liquidity movement, or protocol usage that informs trade research. It cannot prove a trade is good, predict price, or replace liquidity, risk, and execution checks.
Dune dashboard numbers can differ because tools use different chains, contracts, filters, time windows, price sources, labels, and refresh schedules. When numbers disagree, compare the method before choosing the chart you like best.
No, a Dune dashboard is one output inside the broader Dune platform. Dune is the analytics environment, while a dashboard is the page that displays query results as visual research.