Physical Address
304 North Cardinal St.
Dorchester Center, MA 02124
Physical Address
304 North Cardinal St.
Dorchester Center, MA 02124


Learn why liquidation cascades move crypto so fast.
A liquidation cascade is a chain reaction where forced liquidations push crypto prices into more forced liquidations.
It usually starts in leveraged futures, margin, or collateralized lending, then spills into the broader market through forced orders and thin liquidity. That is why a move that begins as a normal dip or squeeze can suddenly turn into the candle everyone screenshots and pretends they saw coming.
A liquidation cascade in crypto is a market chain reaction. One wave of forced position closures moves price enough to trigger another wave, then another.
That feedback loop is why the word cascade fits. It is not one trader losing a position. It is many accounts hitting liquidation zones close together, often while the order book is too thin to absorb the forced buying or selling cleanly.
A liquidation cascade means forced liquidations keep moving price until nearby leveraged positions are also forced closed.
The phrase usually appears around perpetual futures and margin trading. A trader posts initial margin, borrows exposure, and watches a liquidation price. If the mark price crosses the danger zone, the venue closes the position to protect the loaned capital or the platform’s risk system.
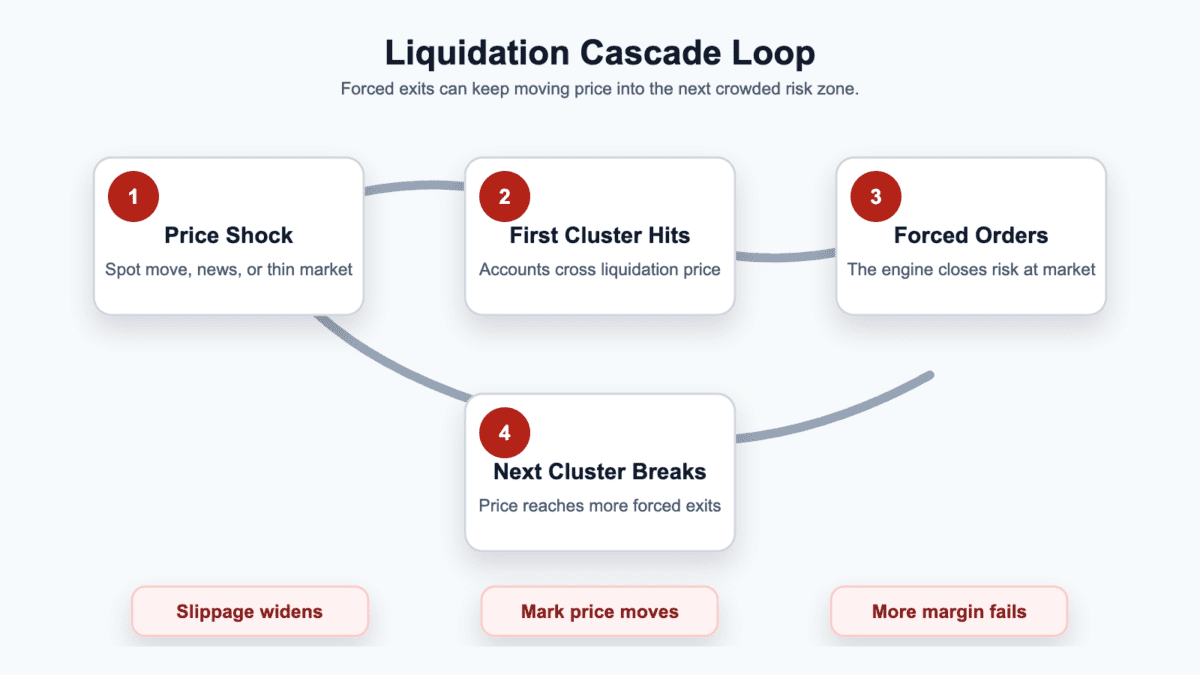
The clean version looks like this:
Then the loop can repeat. The liquidation engine is not looking for fair value. It is closing risk, often in a hurry.
That is why the wick can look strange. During a liquidation cascade, price may overshoot because forced orders do not care whether the asset is “worth” more or less. They care whether an account has enough margin left.
A liquidation cascade starts when leveraged positions lose their margin buffer. The spark can be a price move, but the fuel is usually crowded leverage.
In futures or perpetuals, a trader controls a larger position than their posted collateral. Initial margin opens the trade. Maintenance margin is the minimum buffer needed to keep it open. The liquidation price is the level where the venue can step in and close the trade.
That sounds tidy on a dashboard. Markets are less polite.
The mark price can move because spot markets drop, a macro headline hits, funding becomes crowded, a large holder sells, or liquidity dries up during quiet hours. If many traders used similar leverage near the same entry zone, their liquidation prices may sit close together.
Common triggers feed the cascade in different ways:
| Trigger | How It Feeds The Cascade |
|---|---|
| Crowded long exposure | A price drop liquidates longs and adds forced selling. |
| Crowded short exposure | A price rise liquidates shorts and adds forced buying. |
| Thin order books | Each forced order moves price more than usual. |
| High funding pressure | One side of the market may be overcrowded. |
| Volatility catalyst | News, macro data, or a large spot move can start the first break. |
The trigger is not always dramatic. A small move can be enough when the market is already stacked with fragile positions.
Leverage squeezes the safety buffer. A 5x position has more breathing room than a 50x position. Fees, maintenance margin, mark-price rules, and venue settings change the exact point, but the direction is clear: higher leverage gives normal volatility less space before liquidation.
A liquidation cascade turns small moves into big wicks by forcing execution into a market that may already be losing depth. The first liquidations become new pressure, and that pressure can push price into the next cluster.
Think of the order book as the cushion. When liquidity is deep, a forced order may be absorbed without much damage. When liquidity is thin, the same order can slide through available bids or offers and create slippage.
The mark price matters here. Many venues use a mark price to reduce manipulation from one last traded price. But if the broader market keeps moving, the mark price can still approach liquidation levels and trigger the engine.
Now the ugly part. Liquidated longs often become forced selling. Liquidated shorts often become forced buying. If the market has shallow depth, those orders can force terrible fills, turning traders into someone else’s exit liquidity.
The simple sequence is easier to see in slow motion:
No villain is required. A cascade can happen because many traders took similar risk, at similar prices, with similar liquidation zones. The candle looks personal. The engine is just doing paperwork with a chainsaw.
A long liquidation cascade pushes price down. A short liquidation cascade pushes price up.
The direction depends on which side is overleveraged. Long traders are betting on price rising. If price falls far enough, their positions can be closed through selling. Short traders are betting on price falling. If price rises far enough, their positions can be closed through buying.
Here is the clean comparison:
| Cascade Type | What Happens |
|---|---|
| Long cascade | Falling price liquidates long positions, adding forced selling. |
| Short cascade | Rising price liquidates short positions, adding forced buying. |
| Long squeeze | Longs are pushed out by downside pressure. |
| Short squeeze | Shorts are pushed out by upside pressure. |
| Market effect | The forced side can make the wick overshoot. |
A short squeeze can be part of a liquidation cascade, but the terms are not identical. A short squeeze focuses on short sellers being forced to buy back. A liquidation cascade describes the broader feedback loop of forced closures triggering more forced closures.
That distinction helps during upward wicks. A sharp green candle can look like clean demand, but it may be forced short covering through a thin book. It can still become a real breakout. It can also tempt traders to call a top signal when the move is mostly leverage clearing.
The same caution applies to downside moves: a violent red wick may reflect forced long liquidations, not a sober committee deciding the asset is suddenly worthless. Price can keep falling after the cascade, but the first move often reflects positioning before fundamentals.
Liquidation cascades hit crypto hard because crypto markets mix constant trading, high leverage, fragmented liquidity, and fast narrative shifts. That creates more places for crowded risk to build.
Perpetual futures are central to the story. They let traders take long or short exposure without an expiry date, while funding payments help keep perp prices near spot. Crypto also trades all day, every day, so liquidity can thin during off-hours while liquidations still trigger.
The biggest accelerants are usually easy to spot after the fact:
Altcoins can be especially harsh. Their derivatives markets may look active, but the real depth can vanish quickly. A forced order that barely nudges BTC may wreck a smaller coin’s book.
Fragmentation adds another layer. Prices form across multiple exchanges, DEX perps, spot venues, and lending markets. If one venue starts moving hard, arbitrage can transmit pressure elsewhere. That can stabilize price eventually, but during the fast part it may spread the stress.
So the first answer is not always manipulation. The cleaner explanation is usually less cinematic: leverage was crowded, liquidity was thin, and forced orders did not wait for everyone to feel emotionally ready.
Spot investors are not directly liquidated in a liquidation cascade unless they borrowed, used margin, pledged collateral, or bought structured exposure with liquidation rules. Simple spot ownership does not have a liquidation price.
If you hold BTC in a spot wallet, an exchange cannot forcibly close that spot position just because BTC falls. The position can lose value, of course, and futures liquidations can still widen spreads, trigger panic selling, and hurt weaker altcoins.
Before worrying about the cascade, sort the exposure first:
The confusion usually comes from three different buckets:
| Exposure Type | Liquidation Risk |
|---|---|
| Simple spot holding | No forced liquidation, but price can fall. |
| Margin or futures | Direct liquidation risk if margin fails. |
| DeFi borrowing | Collateral can be sold if the loan becomes unsafe. |
| Structured products | Rules depend on the product design. |
Spot holders should watch cascades because they can change market behavior. A flush can leave late buyers trapped, especially when they bought into a rebound with no plan and thin liquidity. That is where bagholder risk enters the story.
This split changes the choices during the wick. Spot holders can wait, sell, hedge, or rebalance. Leveraged traders may watch the venue make the exit for them once the liquidation line breaks.
So the split is simple. Spot risk is about price and liquidity. Leveraged risk is about price, liquidity, margin, and a forced exit you may not control.
Liquidation cascades can appear on centralized exchanges, decentralized perpetual venues, and DeFi lending platforms. The mechanics differ, but the feedback loop is similar: risk breaks, forced action follows, price or collateral pressure spreads.
Do not assume every cascade is the same type of event. A futures liquidation cascade is not identical to a DeFi lending liquidation wave. One closes leveraged trades. The other sells or seizes collateral to repay unsafe debt.
Centralized futures exchanges usually manage liquidation through margin rules, mark prices, liquidation engines, insurance funds, and sometimes auto-deleveraging. When an account falls below maintenance margin, the exchange may reduce or close the position.
That does not prove an exchange caused a cascade. It means the venue has risk machinery built for stress. Traders still need to know the rules before trading there.
Decentralized perpetuals can create similar forced closures, but the plumbing changes. Smart contracts, keepers, oracle feeds, liquidity providers, and onchain execution costs can all affect the path.
The trade may look like a normal perp position, yet execution depends on decentralized infrastructure. During stress, oracle updates, network congestion, liquidity depth, and keeper behavior can shape how cleanly liquidations happen.
DeFi lending liquidations happen when collateral no longer supports the borrowed amount under protocol rules. Liquidation bots or keepers can repay part of the debt and receive collateral, often with an incentive.
That can cascade when falling collateral prices trigger more liquidations, and those liquidations add selling pressure. Oracle updates, collateral ratios, slippage, and thin liquidity all matter. In lending protocols, Chainlink notes that a health factor below 1 can make a position eligible for liquidation. That is why oracle updates and liquidation bots can turn collateral stress into a repeatable forced-selling loop.
Use this venue map:
| Venue | Main Thing To Check |
|---|---|
| Centralized futures | Mark price, liquidation price, margin mode, insurance fund rules. |
| DEX perps | Oracle design, liquidity depth, keeper execution, network costs. |
| DeFi lending | Collateral ratio, health factor, liquidation penalty, oracle feed. |
Different venue, same lesson. If someone else can close or sell your position when a risk line breaks, you need to know where that line sits before the market finds it for you.
Liquidation heatmaps estimate where leveraged positions may be forced closed. They can show crowded risk zones, but they do not prove where price must go.
Heatmaps usually combine derivatives data with assumptions about leverage, entries, and liquidation levels. Bright zones often mean many positions may sit near that price, which makes the tool useful and easy to overread.
| Useful Signal | Common Mistake |
|---|---|
| Crowded liquidation zones | Assuming price must hit the zone. |
| Long or short pressure | Treating estimates as exact positions. |
| Open interest changes | Ignoring spot liquidity and news catalysts. |
| Cluster density | Calling every move a hunt. |
A heatmap is a pressure map. It is not a prophecy machine, and it is definitely not a moral document proving who is hunting whom.
Use the chart conditionally. If price approaches a large long-liquidation cluster during thin liquidity, downside pressure can accelerate. If price approaches a short cluster after strong spot buying, upside pressure can accelerate. The word “if” is doing real work there.
Also check whether the data source covers the venues that matter for the coin. Some heatmaps may emphasize major centralized exchanges. Others may miss parts of DEX perp activity or lending collateral risk. A neat chart can still be incomplete.
During a liquidation cascade, heatmaps are best used with open interest, funding, order book depth, spot volume, and known catalysts. One tool rarely deserves the steering wheel.
Traders try to avoid liquidation cascades by making sure a normal market move cannot force them out. No tactic removes risk, but several choices make the position less fragile.
The first choice is position size. Smaller exposure gives more room to think. Margin mode matters too: isolated margin limits one position, while cross margin can use more of the account balance and put more capital at risk.
The checklist should happen before entry:
The temptation is to fix bad sizing with more collateral. Sometimes adding margin is a planned risk-control move. Other times it turns one bad trade into full-port behavior with a cleaner excuse.
Stops deserve care too. A stop placed directly on an obvious liquidation cluster may slip or fill badly during stress. A stop placed before the danger zone gives the trader a chance to exit while the engine is still someone else’s problem.
The final check is emotional. If the plan requires watching a position nonstop, adding collateral at 3 a.m., or praying that funding flips, the position is probably too large.
Liquidation cascade examples are clearest after the wick. The useful skill is spotting the conditions that make a cascade more likely before it happens.
Avoid overfitting one old chart. Exact liquidation totals, exchange shares, and dollar figures change by source and time window. The evergreen pattern is more useful: crowded leverage, weak liquidity, forced orders, overshoot, and then either continuation or a sharp snapback.
Warning signs often cluster together:
Read those signals together, not as standalone proof. High open interest can stay high for days. Stretched funding can unwind slowly. A heatmap cluster can also be missed entirely.
The risk rises when several signs stack while liquidity is thin. That is when a trader can reduce size, widen the risk buffer, or skip the trade until the book looks healthier.
After a cascade, price can behave in two opposite ways. It may keep moving because spot sellers join the panic or because new shorts pile in. It may also rebound quickly because forced selling cleared and buyers step back into the order book.
That rebound is why traders sometimes read liquidation flushes as a bottom signal. Be careful. A flush can mark exhaustion, but it can also be the first break in a larger downtrend. Look for funding reset, open interest drop, spot demand, reclaimed levels, and better liquidity before giving one wick too much credit.
Liquidation cascades sit near several crypto concepts, but they are not the same thing. The goal is to separate forced execution from project risk, bad sizing, and social-market slang.
Two related guides help when the wick turns into an argument:
Those ideas can overlap during a violent wick. A short liquidation cascade can create an overheated upward move. A long liquidation cascade can create an exhaustion-looking downside move. Neither gives a clean buy or sell button, because the engine only explains forced flow. It does not predict what fresh buyers or sellers do next.
A liquidation cascade in crypto means forced liquidations trigger more forced liquidations. Price moves into a crowded risk zone, the first positions are closed, and those forced orders push price toward the next liquidation cluster.
A liquidation cascade is not always the same as a crash. A crash is a broad price collapse. A liquidation cascade is the forced-order mechanism that can make a crash faster, sharper, or more exaggerated.
Yes, a liquidation cascade can push crypto prices up when shorts are forced to close. Short liquidations require buying, so a crowded short side can create a sharp upward wick or feed a short squeeze.
Spot Bitcoin holders are not liquidated just because price falls. Direct liquidation requires leverage, margin, borrowing, collateral, or a structured product with forced-exit rules. Spot holders can still lose value from the price move.
Liquidation heatmaps are useful but not exact. They estimate where crowded liquidation zones may sit, but they cannot prove where price must go or whether a specific venue, trader, or whale will force the move.
A short squeeze is an upside move where short sellers are forced to buy back. A liquidation cascade is broader. It can involve long liquidations, short liquidations, DeFi collateral sales, or several forced-order loops at once.