Physical Address
304 North Cardinal St.
Dorchester Center, MA 02124
Physical Address
304 North Cardinal St.
Dorchester Center, MA 02124


A plain guide to curve progress, graduation, and late-buyer risk.
Curve progress in crypto usually means the bonding curve progress percentage: how far a launchpad token has moved toward graduation, migration, or another platform milestone.
You usually see it on fresh-token pages, launchpad dashboards, DEX tools, or trader screens. In that setting, it is usually not about Curve Finance.
That bar can help. It can also be bait with better lighting. A high percentage may point to demand, but it can also mean worse entry pricing, bot attention, crowded exits, and early sellers.
Curve progress in crypto means a token’s current position on a launchpad bonding curve. The percentage usually tracks how close the token is to a platform-defined milestone, such as graduation or migration into a new trading venue.
A bonding curve is the pricing path. Curve progress is the marker on that path. Crypto.com explains the broader mechanic as a price formula tied to token supply, which is the core idea behind most progress bars.
The phrase often appears in fast launchpad markets, DEX dashboards, Solana token pages, and trading tools. It is especially common in crypto trenches, where traders watch new tokens before normal market data exists.
Check the surrounding page before you assume the meaning. A lowercase “curve progress” usually points to bonding curve progress. A capitalized “Curve” can point to Curve Finance, the DeFi protocol, or to a generic math curve. If the page shows a memecoin launch, a progress bar, and a graduation label, the bonding-curve meaning is the one to use.
But the bar is not a safety score. It does not prove honest creators, balanced holders, deep liquidity, or clean execution.
Curve progress works by tracking activity inside a launchpad bonding curve until the token reaches its next state. Buys, sells, reserve balances, token supply, and platform rules can all affect what the percentage means.
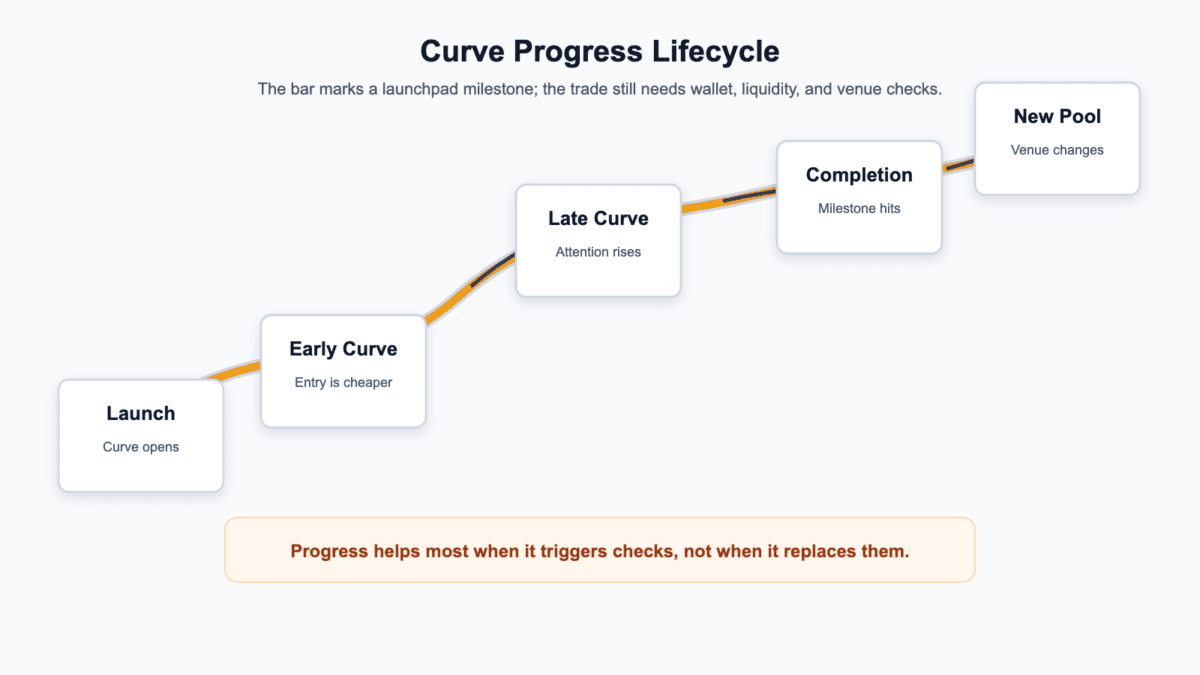
The lifecycle looks cleaner in a diagram than it feels on a live token page. A token can move from quiet to crowded in minutes.
| Curve Stage | What It Can Mean |
|---|---|
| Early | The token is near the start of the curve, so price may be lower but demand is less proven. |
| Middle | More buys have moved the token along the curve, but seller behavior still matters. |
| Late | The token is close to completion, so entry can be expensive and crowded. |
| Stalled | Progress has stopped or slowed, often because demand faded or sellers appeared. |
| Completed | The token has hit the platform milestone, but migration details still need checking. |
The table is a map, not a promise. Launchpads can use different formulas, thresholds, reserve assets, and migration rules. Always ask what this platform does at this percentage.
Buys can move curve progress forward because they add demand to the launchpad curve. On many curves, each buy pushes the token farther along the path and can make the next buy more expensive.
That is why late-stage curves feel urgent. More progress can mean more confirmation, but it can also mean worse price.
Sells can move curve progress back when selling into the curve reduces supply or reserve progress. Some launchpads show a one-way graduation metric, while others reflect redemptions or sell pressure.
Check the bar beside recent trades. If sellers hit every green candle, the percentage may hide a tug-of-war between new buyers and early exits.
The formula depends on the launchpad because each platform chooses its own supply allocation, reserve model, completion trigger, fees, and migration destination. Pump.fun-style launches, Moonshot-style launches, and Meteora-related flows should not be flattened into one template.
Avoid hard-coding old thresholds into your thinking. Platform rules can change, and third-party dashboards can lag or label states differently. A progress number is only useful after you know which launchpad produced it.
One hundred percent curve progress usually means the launchpad curve has reached its completion milestone. The token may graduate, migrate, or enter a new trading phase.
That moment often changes where trading happens. The token may move from curve-based trading into an AMM pool, a DEX venue, or a platform-specific post-graduation market. It can also create confusion while tools update.
Graduation or migration is platform-specific because each launchpad controls its own rules. On some systems, completion creates or points to a new pool. On others, it is only one state in a longer sequence.
Bitquery tracks Pump.fun to PumpSwap migration flows, including the shift from launchpad trading to AMM trading. That helps with Pump.fun context, but it should not be pasted onto every launchpad token.
Trading may move to a new pool after curve completion. That new pool can have a different address, different liquidity depth, and different execution behavior from the curve stage.
So the post-completion check is simple: confirm the mint address, the pool address, the venue, and the route your wallet will use. A fake or stale pool is an expensive way to learn that “100 percent” was not enough information.
One hundred percent curve progress does not mean the trade is safe. It means one mechanical step completed.
The token can still dump after migration. Early holders can sell. Bots can race the first post-graduation pool. Liquidity can be thin.
High curve progress can still be risky because visibility often arrives with worse pricing, more attention, and more pressure from early buyers looking for an exit.
A nearly full curve can become a top signal when everyone reads the same progress bar as permission to chase. That does not mean every late curve fails. It means the easy part may already be behind you.
Later buyers often pay more because many bonding curves raise price as demand pushes the token forward. That is the point of the mechanism.
The tradeoff is uncomfortable. Early entries are cheaper but less proven. Late entries have more confirmation and more expensive execution.
Fast progress can invite bots because the same public data that helps humans also helps automated systems. Bots can watch curve percentage, recent trades, holders, and migration states faster than a manual trader can refresh.
That does not mean every high-progress token is unwinnable. It means alerts compress the window, and faster actors may already be positioned.
A nearly full curve can become a crowded exit when early buyers plan to sell into the attention created by graduation. The late buyer can become the liquidity someone else needed.
That is the classic bagholder setup. Exit liquidity deserves more attention than the progress percentage alone. A full curve can create a new venue, but it cannot force later buyers to appear at your price.
Curve progress risks start with the gap between a mechanical milestone and real market quality. The progress bar can be accurate while the trade is still poor.
Use the percentage as a reason to check harder, not as a reason to skip checks. The useful clues sit around wallet behavior, sell pressure, liquidity, social quality, and tool safety.
Bot and sniper risk is the risk that faster traders act on curve progress before manual users can. Late-stage curves often attract alerts, priority-fee games, and automated migration monitoring.
Watch for sudden buy bursts followed by instant sells. Also watch for tools that ask for broad wallet permissions just to track progress.
Holder concentration and bundled buys show whether the progress bar came from broad demand or a tight wallet cluster. A token can move quickly because many users bought, or because one group moved it together.
Check holder distribution, linked wallets, dev wallet behavior, and early buys. If one cluster controls the story, the curve can look healthy while the sell button is sitting in one room.
Failed graduation happens when a token does not complete its curve or cannot move cleanly into the next phase. The result can be weak discovery, thin liquidity, and fading attention.
This is different from a hard rug, where liquidity or contract controls may be abused more directly. It can also differ from a soft rug, where creators or insiders slowly drain confidence while the project still appears alive.
Post-graduation dumps happen when holders sell after the milestone creates fresh attention or liquidity.
Slang is noisy; behavior is the useful signal. Jeets are often blamed for fast selling, but the real question is simpler: who can sell, how much, and into whom?
Slippage and exit liquidity decide whether the visible price is close to the price you can actually get. A small pool can show a price that collapses when you trade size.
Check reserve or liquidity data, buy and sell balance, fees, and whether the token already trades on a DEX. If identity is part of the pitch, separate an anon dev from a doxxed creator, but neither label proves safety.
Before reacting to a high progress bar, run these checks:
The point is to stop one progress bar from replacing nine better checks.
Reading curve progress well means using the visible percentage as a starting point, then checking the evidence around it. Start with the bar, check who moved it, then check what changes after completion.
Use that order because a progress bar is easy to see and easy to overrate. A clean workflow keeps the bar in its lane.
Start with the progress bar because it tells you the token’s current lifecycle stage. Is it early, middle, late, stalled, completed, or already migrated?
Then ask what the platform does at that stage. If the token is late in the curve, expect steeper pricing and more attention. If it is early, expect less proof and more project-quality risk.
Then check who is buying: curve progress can come from organic demand, coordinated wallets, or a temporary hype push. The same percentage can hide very different market behavior.
Look at wallet spread, repeat buyers, dev behavior, and sell pressure. A hot narrative coin can move quickly because a story is spreading, or because a small group made the chart look alive.
Then check what happens after graduation because the next venue controls execution. The key details are pool address, route, liquidity depth, slippage, and migration state.
Size the trade like a lottery ticket if the evidence is thin. Low-progress speculation is not automatically a bottom signal, and high-progress confirmation is not automatically a clean entry.
A practical reading workflow looks like this:
The last step is boring. It also keeps “almost graduated” from turning into “why am I holding this?”
Curve progress is a status metric, while the bonding curve is the pricing mechanism. Graduation, migration, liquidity pools, AMMs, and slippage are related, but distinct.
Keeping the labels separate prevents bad assumptions. A token can have high curve progress before it has a deep pool, and it can migrate while still trading terribly.
| Term | What It Means |
|---|---|
| Bonding Curve | The pricing mechanism that moves token price as buying or selling changes supply or reserves. |
| Curve Progress | The percentage showing where the token sits along that launchpad curve or milestone path. |
| Graduation | The platform milestone that may happen when the curve reaches completion. |
| Migration | The movement into a new venue, pool, or post-curve trading state. |
| Liquidity Pool | A pool of assets used for trading after or outside the curve phase. |
| AMM | An automated market maker that prices trades from pool balances. |
| Slippage | The gap between the expected trade price and the executed price. |
The simplest split is this: the curve sets the early price path, curve progress shows how far along that path the token is, and the pool handles trading after migration when the platform routes it there.
That split also explains why old screenshots can mislead. A 100 percent screenshot may not show the live pool, current liquidity, or seller behavior.
Traders and bots use curve progress data to spot tokens near key lifecycle moments. They may watch progress percentage, completion state, pool addresses, recent trades, holder changes, and price.
Caution helps here. Progress alerts can be useful, but the same alert can pull a crowd into a late trade.
Alerts can be useful because they reduce manual refreshing. They can be dangerous because they turn every near-complete curve into a small panic button.
Before trusting an alert, check the source, delay, token address, and permission model. Random Telegram tools and browser popups deserve suspicion. Flashy buttons often want your signature.
Manual traders are usually later than bots because automated systems can query data, simulate execution, and submit transactions faster. That timing gap is especially sharp around late progress and migration.
The useful response is not to pretend you can out-click every bot. It is to avoid trades where your whole thesis depends on being faster than machines already watching the same number.
APIs track more than the progress bar because serious dashboards need lifecycle state, pool addresses, completion flags, price data, and recent trades. CoinGecko’s 2026 API guide lists bonding-curve data support for nine launchpad categories. It also shows data fields such as graduation percentage, completion status, and migrated pool address.
That does not mean a beginner needs an API key. It means the visible bar is only one layer. Good tools show what changed around the bar.
Curve progress examples vary across launchpads because each platform can choose different curve math, completion rules, supply allocation, fees, and destination venues.
On many Solana launchpads, the progress bar describes a token’s early launch phase before it trades in a normal pool. But exact paths differ.
Pump.fun style progress usually points to how close a token is to completing its launchpad curve and moving into the next venue. Depending on current platform rules and data tooling, users may see labels around graduation, migration, completion, or PumpSwap trading.
Use the platform’s current state, not old social posts. A stale “Raydium migration” claim can be wrong if the platform now uses a different route.
Moonshot and Meteora deserve separate checks because those names can refer to launch or liquidity systems with their own rules. A percentage on one platform may not match another.
This is why universal formulas are risky in beginner guides. A platform can define progress from allocation, reserves, market cap, or completion state. The number only makes sense inside that platform’s design.
Old numbers can mislead because launchpads change, dashboards update, and market venues shift.
Use old posts for vocabulary. Use live tools and primary platform data for state. Then use common sense for the trade.
Start curve progress checks by identifying the launchpad, token address, curve state, and post-completion venue. Those details reveal whether the bar is early context, late-stage FOMO, or a migration check.
Do not turn this into a shopping path. This topic is about reading risk, not choosing an exchange or wallet. Start here:
The last action protects position size. A high progress bar can tempt users to full port because the bar looks close to a moment. The more crowded the signal, the more discipline matters.
If the checks feel like too much, that is useful information. It means the trade needs a smaller size, a slower decision, or no trade at all.
Related terms help because curve progress sits inside launchpad slang, risk slang, and market-structure language. The right next page depends on which part of the progress bar is confusing you.
A few terms are worth keeping close:
Use these terms as checklists, not decorations. If a token needs slang to explain why the risk is fine, the risk probably is not fine.
Curve progress means how far a token has moved along a launchpad bonding curve toward graduation, migration, or completion. It is usually shown as a percentage.
At 100 percent curve progress, the token usually reaches the launchpad’s completion milestone. Depending on the platform, it may graduate, migrate, or enter another post-curve state.
High curve progress can be bullish if it reflects real demand and clean holder behavior. It can also mean the entry is late, bots are watching, and early buyers are closer to selling.
Curve progress can move backward on systems where sells reduce the curve’s supply or reserve progress. Some platforms may show a one-way completion metric, so check how that launchpad calculates the number.
Curve progress does not mean liquidity is locked. It shows movement toward a launchpad milestone, while liquidity lock status, pool depth, and sell pressure must be checked separately.
Curve progress is not the same on every launchpad. Platforms can use different formulas, thresholds, fees, supply allocation, and migration destinations.