Physical Address
304 North Cardinal St.
Dorchester Center, MA 02124
Physical Address
304 North Cardinal St.
Dorchester Center, MA 02124


Learn how burn rate works before supply hype gets expensive.
Burn rate in crypto is the pace at which tokens are permanently removed from supply over a chosen period.
You will usually see burn rate in tokenomics posts, exchange-token updates, Ethereum fee-burn debates, and meme coin headlines. The number helps only when you know the period, the supply base, and whether new tokens are still being issued.
Burn rate in crypto means how quickly a token supply is being reduced by burns. It can be shown as tokens burned per day, week, month, or quarter, or as a percentage of total or circulating supply.
A token burn is the event. Burn rate is the pace. That difference is small on paper and expensive in practice.
If a project burns 10 million tokens once, that is a burn event. If it burns about 10 million tokens every month, that monthly pace is the burn rate.
Break a burn-rate claim into three parts:
That last part is where many headlines get slippery. A burn rate measured against total supply can look very different from one measured against circulating supply. A burn from locked treasury tokens can also matter less than a burn from liquid tokens bought on the open market.
So a clean burn rate is not just a shiny percentage. It is a supply-change metric with context attached.
Burn rate is easy to confuse with other burn language because crypto recycles the same few words. In tokenomics, burn rate is about token supply being destroyed. In startup or DAO finance, cash burn rate is about money leaving a treasury.
The table below separates burn terms that often get shoved into one noisy post.
| Term | What It Means |
|---|---|
| Burn rate | The pace of tokens permanently removed during a set period. |
| Token burn | A specific event where tokens are sent to an inaccessible address or destroyed by contract logic. |
| Burned supply | The cumulative amount of tokens already removed from supply. |
| Locked supply | Tokens that cannot currently move, but may become liquid later. |
| Cash burn | The speed at which a team, DAO, or startup spends treasury funds. |
Burned supply is historical. Burn rate is current speed. A project may have burned a large amount years ago and still have a low burn rate today.
Locked supply is another common trap. Locked tokens are restricted, but they are not necessarily gone. If they become tradable later, they can still hit the market.
Cash burn belongs in treasury analysis. It tells you how long a team can keep operating before it needs more money. Token burn rate stays on supply: how quickly tokens are being removed.
Burn rate is calculated by dividing tokens burned during a period by the supply number you want to test. Then multiply by 100 if you want a percentage.
The simplest version looks like this:
Burn rate = tokens burned during period / supply base x 100
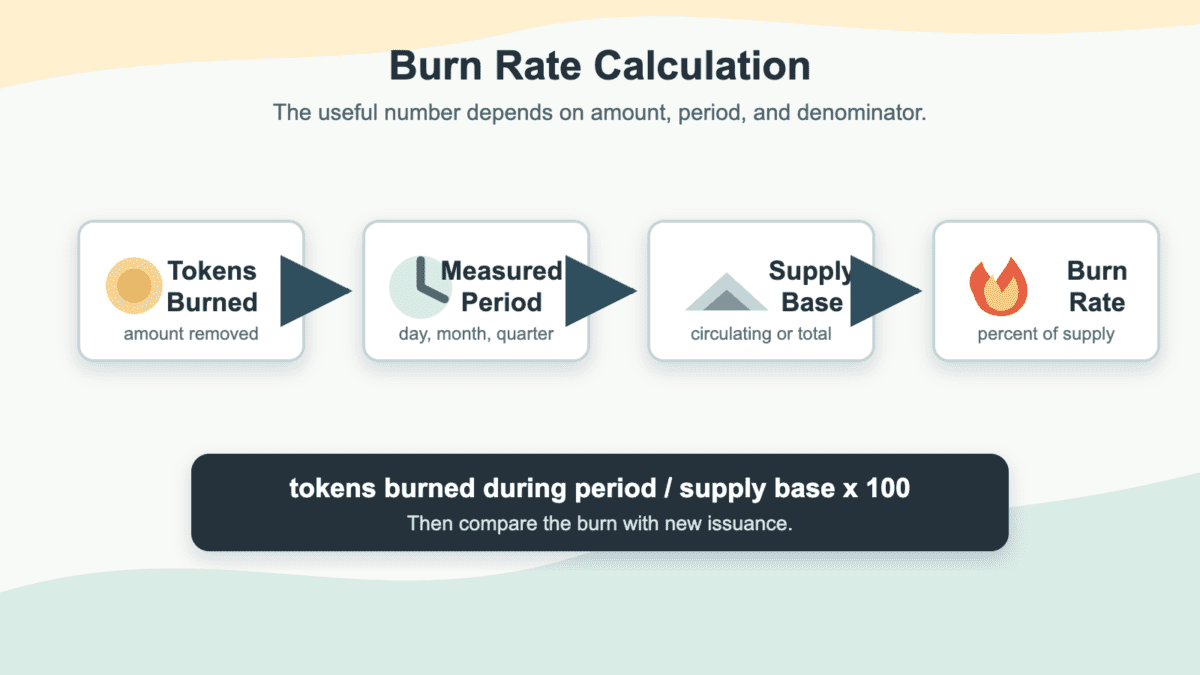
If a token burns 2 million tokens in a month and has 1 billion circulating tokens, the monthly burn rate against circulating supply is 0.2%. Annualizing that suggests 2.4% per year if the same pace continues, but that assumption deserves a warning label.
Burn rates move. Activity changes, fees change, community burns slow down, and teams can change burn schedules. Annualizing is useful for scale, not prophecy.
The supply base also changes the answer. Total supply is broad. Circulating supply is closer to what traders can buy and sell.
Use this table before trusting a single burn-rate number.
| Burn Rate Input | What It Can Hide |
|---|---|
| Tokens burned | A large token count can still be tiny versus supply. |
| Period measured | One-day spikes can fade fast. |
| Total supply | It may include locked or inactive tokens. |
| Circulating supply | It can miss supply that may become liquid soon. |
| Annualized rate | It assumes the current pace continues. |
| Net issuance | New tokens may offset the burn. |
A better calculation asks both gross and net questions. Gross burn rate tells you how much was removed. Net supply change tells you whether burns actually beat new issuance.
That is the cleaner habit: read the burn, check the denominator, then ask what new supply entered.
Burn rate headlines can look huge because percentage changes often compare today’s burn with yesterday’s tiny baseline. A jump from a small number can create a giant percentage without creating a giant supply effect.
Imagine yesterday’s burn was 10,000 tokens and today’s burn was 1 million tokens. The daily burn jumped 9,900%. That sounds dramatic. But if the token supply is 1 trillion, today’s burn is still only 0.0001% of supply. This is why meme coin burn posts need extra suspicion.
Watch for the headline pattern:
That pattern does not prove bad intent. It does mean the headline is doing more work than the burn itself.
Burn stories also feed narrative trading. If a token is already moving, a burn spike can become one more reason for people to chase a narrative coin. Read it cold: a burn-rate spike is a lead to investigate, not a buy signal by itself.
The check is simple. Convert every burn headline into a percentage of circulating supply. If the result rounds down to dust, the headline is mostly theater.
Burn rate can affect price by reducing supply, but it does not force price to rise. The price impact depends on demand, liquidity, market expectations, and whether the burned tokens were likely to sell.
Supply reduction helps most when it removes tokens that could otherwise pressure the market. If a project buys tokens from the market and burns them, that can reduce available supply and add buy pressure during the purchase.
Demand is the other half. A shrinking supply means little if buyers are leaving, usage is fading, or traders already priced in the burn. Scarcity without demand is just a smaller pile.
A burn rate becomes more meaningful when these conditions line up:
After the supply check, read the market context around it:
Burn rate and net issuance belong together because a token can burn supply and still inflate. The important equation is new issuance minus burned tokens.
Use the simple version:
Net supply change = new tokens issued - tokens burned
If a network issues 100,000 new tokens in a period and burns 40,000, net supply still rises by 60,000. If it issues 40,000 and burns 100,000, net supply falls by 60,000.
Ethereum is the clean example because its burn mechanism is tied to network fees. Under EIP-1559, the base fee portion of a transaction fee is burned, while users can add a priority fee for validators.
That means Ethereum’s burn rate can rise when blockspace demand rises. But the burn side is only one part of the net supply picture. Validator rewards and other issuance mechanics still need the same-period comparison.
This is why ETH debates can flip tone during busy and quiet periods:
The same logic applies beyond Ethereum. Any token with ongoing issuance needs a net supply check. A burn mechanism can slow inflation, offset it, or push supply lower.
For investors, net issuance keeps burn-rate hype honest. It asks whether supply changed after both the faucet and the drain ran.
Crypto burn rate mechanisms differ because projects burn tokens for different reasons. Some burns are scheduled. Some are tied to activity. Others are manual social events.
The mechanism changes how predictable the burn rate is. A scheduled burn may be easier to model. A fee burn may rise and fall with usage. A community burn may depend on donations, campaigns, or mood.
The table below gives the main burn types and the check that keeps each one grounded.
| Burn Mechanism | What To Check |
|---|---|
| Scheduled burn | Whether the formula, dates, and supply target are clear. |
| Fee burn | Whether real activity creates the burned fees. |
| Buyback and burn | Whether tokens were bought from the market before being burned. |
| Treasury burn | Whether burned tokens were liquid, locked, or unlikely to sell. |
| Community burn | Who funded it and whether a promotion is attached. |
| Mint-burn system | Whether minting and burning keep wrapped or issued assets balanced. |
The examples are different enough that they should not be blended:
For a current scale check, BNB Chain reported in April 2026 that its quarterly Auto-Burn removed 1,569,307.34 BNB. That number is useful only because the mechanism, period, and transaction trail are named; without those, the raw burn total is still just a headline.
You verify a burn rate claim by moving from the announcement to the on-chain record. A real burn should leave a transaction trail, a destination or contract event, and a supply effect you can inspect.
Start with the transaction hash. If a project announces a burn but gives no hash, address, contract event, or explorer link, the claim is incomplete. Screenshots can be polished. Chain records are harder to dress up.
Use this checklist before trusting a burn-rate post:
Then check where the tokens went. A burn address, dead wallet, eater address, or null address should be inaccessible by design. On some tokens, the burn may happen through contract logic rather than a normal transfer.
Etherscan and BscScan are common explorer examples, but the right tool depends on the chain. The point is not the brand of explorer. The point is whether the burn can be traced without trusting the loudest account in the thread.
Be careful with trackers too. Burn dashboards can be useful, but no tracker should replace the underlying chain check when money is at stake. Trackers may use different methods, miss some contract events, or lag during busy periods.
Also ask whether the burn removed meaningful supply. A transaction can be real and still irrelevant.
Burn rate red flags appear when a project uses supply reduction as a substitute for trust, demand, or clear on-chain proof. A burn can be real and still carry a misleading pitch.
The ugliest version is a burn claim dropped right after bad news. Maybe liquidity is thin. Maybe holders are asking hard questions. Suddenly the project announces a burn and asks everyone to focus on the flames.
Slow down when these signals show up:
Some burn campaigns overlap with rug risk. A team can use a token burn to project discipline while insiders still control wallets, liquidity, or mint permissions. That is where burn-rate analysis should sit beside hard rug and soft rug checks.
Timing is also a signal. A burn announcement after a vertical pump can be a top signal if it mostly gives late buyers a story. A panic burn near capitulation can be a bottom signal only when broader demand and liquidity confirm it. The wallet map, supply base, issuance schedule, and liquidity pool carry the rest of the story.
Burn rate examples are useful when they teach the mechanism, not when they pretend live numbers stay fresh. ETH, BNB, SHIB, and community burns show four different ways burn talk enters the market, and each one asks for a different check.
Use examples this way:
For ETH, the burn-rate question usually starts with activity. If users pay more base fees, more ETH can be burned. But the burn still has to be compared with issuance before anyone claims supply is falling.
For BNB-style burns, check whether the formula, schedule, and transaction trail are clear. Formula-driven burns are easier to follow than vague promises, but they still do not replace demand.
For SHIB-style headlines, the denominator does most of the work. A giant-looking token count can still be tiny against a very large supply, which is why percentage-of-supply math belongs next to every meme coin burn claim.
Community burns need the incentive check. If the burn is tied to a new sale, donation wallet, or promotional campaign, the supply story may be sharing the stage with marketing.
None of these examples is a recommendation. The useful comparison is which burn mechanism removes meaningful supply, can be verified on-chain, and still makes sense after demand and issuance are checked.
Related crypto supply and risk terms help you read burn-rate claims without getting trapped by one metric. Use them as context checks, not a second pile of links.
These concepts are most useful around burn-rate posts because each one catches a different blind spot:
Taken together, these terms keep the burn rate in its lane. CT explains why the claim spreads. Trenches explain why fast-moving communities may reward the loud version first. Meta explains whether traders care about supply mechanics that week.
Jeets and conviction plays point in opposite directions. If holders sell every burn spike, supply reduction may not get time to matter. If someone wants to hold through noise, the burn rate still needs on-chain proof, net issuance context, and real demand.
The key is not to memorize every term. It is to stop turning one burn-rate metric into a full investment thesis.
Start with the burn-rate claim itself, then strip it down to numbers you can verify. A strong claim should survive basic math, chain checks, and demand questions.
Begin with the period and amount. Then compare the burn with circulating supply and new issuance. Only after that should you think about price.
Use this order when you see a burn-rate post:
Then look at incentives. A buyback-and-burn can tell a different story from a treasury burn, and both differ from a community burn funded by holders. The source of the tokens affects how much selling pressure was actually removed.
If any step is missing, mark the claim as incomplete. Missing proof does not automatically mean fraud, but it means you do not have enough to price the claim cleanly.
The best burn-rate posts are boring in a good way. They show the transaction, mechanism, period, supply base, and net effect. If a post cannot do that, the missing piece is usually more important than the percentage in the headline.
That is the final habit. Read the burn rate as a lead, then make the claim earn the next minute of your attention.
Burn rate in crypto means the speed at which tokens are permanently removed from supply over a chosen period. It is usually shown as tokens burned per day, week, month, or quarter, or as a percentage of supply.
Crypto burn rate is calculated by dividing tokens burned during a period by total supply or circulating supply, then multiplying by 100. The result is only useful when the period and denominator are clear.
Token burn rate is not the same as burned supply. Burn rate measures current pace, while burned supply measures the cumulative amount already removed.
A higher burn rate does not guarantee a higher crypto price. Price also depends on demand, liquidity, market expectations, issuance, and whether the burned tokens were likely to sell.
SHIB burn rate can rise without price rising because the burn may be tiny relative to supply, demand may be weak, or traders may have already priced in the headline.
Burn rate is not always the same as cash burn. In tokenomics, burn rate means supply destruction. In company finance, cash burn means how fast a team spends treasury funds.