Physical Address
304 North Cardinal St.
Dorchester Center, MA 02124
Physical Address
304 North Cardinal St.
Dorchester Center, MA 02124


A plain guide to bonding curve pricing, launches, and trader risk.
A bonding curve in crypto is a smart-contract pricing formula that links a token’s price to its supply or reserves, so buys and sells move the price along the curve.
You will usually meet a bonding curve on token launchpads, DeFi apps, and meme-coin pages where price changes automatically as people buy or sell. It can help a token launch without a deep starting pool, but it does not make the token safe, fairly distributed, or easy to sell after hype fades.
A bonding curve means the token has a pricing rule instead of a normal seller setting every price. The smart contract decides how many tokens you receive for a buy and how much reserve asset you get back on a sell.
That reserve asset is often SOL, ETH, USDC, or another token. In plain language, imagine a token starts cheap, more buyers arrive, supply grows, and the next buyer pays more because the curve moved upward.
In practice, “bonding curve crypto” can describe a few related setups. The same phrase may point to the launch mechanism, the reserve design, or the pricing formula behind a token page.
The useful clue is the rule behind the market. A bonding curve is a pricing function in code, not a chart pattern, a safety badge, or proof that a launch is fair.
A bonding curve changes token price by making each buy or sell move through a formula. When buying pressure rises, the price usually moves up the curve. When selling pressure rises, the price usually moves down.
That movement creates price impact. A small buy may barely shift the curve. A larger buy can pay a higher average price because part of the order executes after the curve has already moved.
Use tiny numbers to keep the idea human:
Here is the basic loop:
| Action | What Happens |
|---|---|
| A buyer sends reserve asset | The contract calculates tokens received and moves price up |
| More buyers enter | Supply or reserve depth grows, and later tokens cost more |
| A holder sells back | The contract pays reserve asset and usually moves price down |
| A large order hits | The fill can average across several prices on the curve |
| Demand fades | Sellers may face worse exits as price slides down |
The math can get more complex, but the user experience stays simple. Buying earlier can be cheaper. Buying later can be more expensive. Selling into weak demand can be ugly.
Slippage is the practical warning. If a curve is steep, a normal-looking trade can move the price more than expected. That is where a clean formula starts acting like a very expensive lesson.
A bonding curve and an AMM can both use formulas, but they are not always the same thing. A bonding-curve launch often prices a token during issuance. An AMM usually swaps between assets already sitting in a liquidity pool.
The confusion happens because both systems replace a traditional order book. Instead, a contract calculates the execution.
The split becomes visible when a token graduates from a launchpad curve to a DEX pool:
| Bonding-Curve Launch Phase | DEX Or AMM Phase |
|---|---|
| Price comes from the launch curve | Price comes from pool balances and swaps |
| Trades may mint or burn through the launch contract | Trades swap existing assets in a pool |
| Liquidity is tied to the curve’s reserve design | Liquidity depends on pool depth and LP setup |
| Selling may happen through the launchpad interface | Selling may move to a DEX, aggregator, or pool |
| Main risk is curve price, progress, reserves, and sellability | Main risk is pool depth, slippage, fees, and exit pressure |
This is why an “AMM bonding curve” phrase can be slippery. Uniswap-style pools use a formula, but that does not mean they work like a token issuance curve.
The simplest split is this: a launch curve can be the token’s first market, while an AMM can be the token’s later market. That change can alter fills, slippage, chart behavior, and where bots route orders.
A bonding curve token launch uses the curve as the first market for a new token. The creator does not need to seed a deep order book first because the contract creates automated price discovery.
The early launch flow is usually straightforward. It is also where a lot of bad assumptions are born.
A typical launch runs like this:

For builders, the appeal is obvious. A bonding curve can reduce the need for upfront liquidity and make a launch look active quickly. For traders, the appeal is earlier access, which only helps if the token has real demand, clear sell paths, and sane controls.
This is where the crypto trenches language fits. A bonding curve can turn a fresh launch into a fast public market, but speed does not create quality. It only removes friction.
An anon dev can still buy their own curve, coordinate wallets, abandon the project, or sell into attention. The curve may automate price discovery, but it does not automate trust.
Bonding curve progress on Pump.fun style launchpads usually shows how far a token has moved through its launch curve before migration or graduation. In this context, “bonding” often means the launch curve is filling, while “graduation” means the token leaves the launch phase and moves to a different venue.
Pump.fun’s fees page was last updated on May 20, 2026, and lists graduation from the pump.fun platform to PumpSwap. The same Fees page lists a 1.25% total fee for bonding-curve trades on both SOL and USDC tokens. Keep exact platform numbers out of your mental autopilot because old pages may still mention Raydium migration or stale thresholds.
Graduation changes where price discovery happens. Before graduation, the launch curve is the main pricing engine. After graduation, the AMM pool, its depth, and its swap flow carry more weight.
That can widen access. More traders, bots, and aggregators may route through the post-graduation venue. But graduation is not a medal. It can also create a cleaner exit lane for early buyers.
Post-graduation price can differ because the pricing engine changes. A curve price, pool price, aggregator quote, and chart price can diverge during migration, especially when liquidity is thin or orders arrive quickly.
The practical checks are simple:
> Warning: Graduation is a venue change. It does not prove the creator is honest, the holders are aligned, or the token has durable demand.
A February 2026 arXiv paper studied Pump.fun launches as bonding-curve-based market behavior, including graduation probability. That is a useful signal for one reason: these launches are now active market structure, not just math-class tokenomics.
A bonding curve can protect against some messy launch problems, but it does not remove token risk. It can make early pricing more transparent and reduce the need for a creator-controlled liquidity setup.
That limited protection gets overstated. A curve may reduce one version of a hard rug, such as a simple manual pool pull. It does not stop a soft rug where insiders slowly sell, abandon work, or drain attention.
A bonding curve may help with these problems:
But it does not solve the problems traders actually trip over:
That last point connects directly to exit liquidity. If late buyers arrive because graduation looks bullish, earlier buyers may finally have enough demand to sell.
The curve also does not protect you from becoming a bagholder. Fast sellers, or jeets, can hit the curve or the new pool as soon as momentum weakens.
Bonding curve shape controls how quickly price changes as buying or selling moves through the formula. The shape decides whether price rises gently, accelerates fast, or rewards early buyers heavily.
Most users do not need calculus. They need to know what the curve feels like when they trade.
| Curve Shape | What Users Feel |
|---|---|
| Linear | Price rises at a steady pace as supply grows |
| Exponential | Price can accelerate hard after early buying |
| Logarithmic | Early price moves can be larger, then slow later |
| Sigmoid | Price may start slow, speed up, then flatten |
| Constant-product related | Price shifts based on balance changes between pooled assets |
A steep curve can make early entries look brilliant and later entries fragile. A flatter curve may feel calmer, but it can struggle to create urgency for launches that depend on attention, speed, and visible progress.
Curve shape also affects slippage. If your trade size is large compared with the curve’s reserve depth, the average fill can be much worse than the first price you saw. So the bonding curve formula is not trivia. It controls incentives.
The bonding curve shows up beyond meme coins because it is a design tool for pricing scarce or growing digital assets. The same primitive can appear in token launches, creator markets, NFTs, DAO funding, and DeFi bootstrapping.
Bancor helped popularize smart-token reserve ideas. Curation markets used bonding curves to price attention around lists or signals. Friend.tech made social keys trade along app-specific curves. Hashmasks used changing NFT pricing. Fei Protocol used a bonding-curve-style sale in a broader stablecoin design.
Those examples do not prove the model is always good. They show why the primitive keeps returning:
That last feature is both the attraction and the problem. A curve can bootstrap activity, but it can also reward whoever arrives first, automates fastest, or understands the rules better.
For DAOs and creator tokens, the risk is incentive design. For NFTs, the risk is whether demand survives after the pricing novelty fades. The bonding curve is the tool. The market around it decides whether the tool creates a useful launch or a beautiful ramp into a wall.
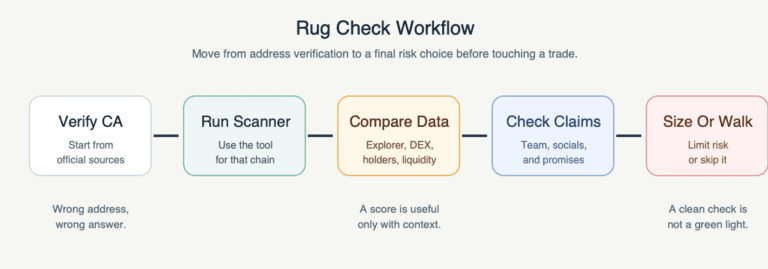
To check a bonding curve token before buying, verify the phase, sell path, holder setup, token controls, and liquidity depth before you focus on the chart. A rising curve is not a full risk review.
Start with the market state. Are you buying during the curve phase, near graduation, or after the token has moved to an AMM pool? Each phase has different risks.
Use this checklist before entering:
The holder check carries real weight because a few wallets can overpower public demand. A token can have a clean curve and still become a top signal if early wallets are unloading into a crowded story. A weak-looking launch can form a bottom signal only if selling pressure fades and real demand appears.
Narrative can change demand quickly. A narrative coin can run because the story is hot, then fall when the story rotates. A doxxed team may reduce some accountability risk, but wallet, permission, and trading checks still carry more weight.
Related bonding curve terms help you read the launch around the curve. The formula is only one part of the setup. Trader behavior, liquidity, and social timing do the rest.
Useful related ideas include:
The common thread is timing. Bonding curves make entry timing visible, but related terms explain who may be selling, why attention arrived, and whether the crowd is early or already serving as someone else’s exit.
A bonding curve in crypto is a smart-contract pricing rule that links token price to supply, reserves, or both. In many launches, buys push the token up the curve and sells push it down.
The phrase often appears on token launchpads, especially when a fresh token has not yet moved to a normal DEX pool. It describes the pricing mechanism, not the quality of the token.
A bonding curve is not always the same as an AMM. A bonding curve often handles token issuance or launch pricing, while an AMM usually swaps two existing assets inside a liquidity pool.
They are related because both can use formulas instead of order books. The difference shows up when a token graduates and pricing moves from a launch curve to a DEX pool.
Bonding curve progress usually means how far a launch token has moved through its curve before a migration or graduation event. On launchpads, it can show how close the token is to leaving the curve phase.
Progress does not mean the token is safer or more valuable. It only describes where the token sits in that platform’s launch process.
When a bonding curve token graduates, it usually moves from launch-curve pricing to a different trading venue, such as an AMM pool. The token may become easier to trade through DEX routes.
The price can still change sharply after graduation. Early holders may sell, liquidity may be thin, and the AMM quote may differ from the last curve price.
A bonding curve does not stop rug pulls by itself. It may reduce some manual liquidity-pull risk, but it does not remove creator exits, holder concentration, bad token authorities, bots, or demand collapse.
Always check sellability, holders, permissions, reserve design, and post-graduation liquidity. The curve is one control, not a full safety system.
Yes, you can lose money on a bonding curve. Price can move down when sellers exit, and a steep curve can make late entries especially fragile.
Losses can also come from slippage, fees, thin reserves, bad timing, bot activity, or weak demand after graduation. The formula can be transparent and still produce a painful trade.
Start with the phase. A bonding curve token behaves differently before graduation, during migration, and after it reaches an AMM pool.
Then check the mechanics before the mood. A good-looking progress bar is less useful than knowing where liquidity sits and whether you can actually sell.
Use these actions before taking risk:
The cleanest habit is boring: know the pricing engine before you trade it. Then check whether the same token still has buyers after the easy launch story is gone.
A bonding curve can be useful, but it will not rescue a weak token from weak demand. If the only reason to buy is that the curve is almost full, you are reading a progress bar as a thesis.